Celtic vs Immigrants from Colombia Child Poverty Under the Age of 5
COMPARE
Celtic
Immigrants from Colombia
Child Poverty Under the Age of 5
Child Poverty Under the Age of 5 Comparison
Celtics
Immigrants from Colombia
17.9%
CHILD POVERTY UNDER THE AGE OF 5
18.3/ 100
METRIC RATING
198th/ 347
METRIC RANK
16.9%
CHILD POVERTY UNDER THE AGE OF 5
66.9/ 100
METRIC RATING
165th/ 347
METRIC RANK
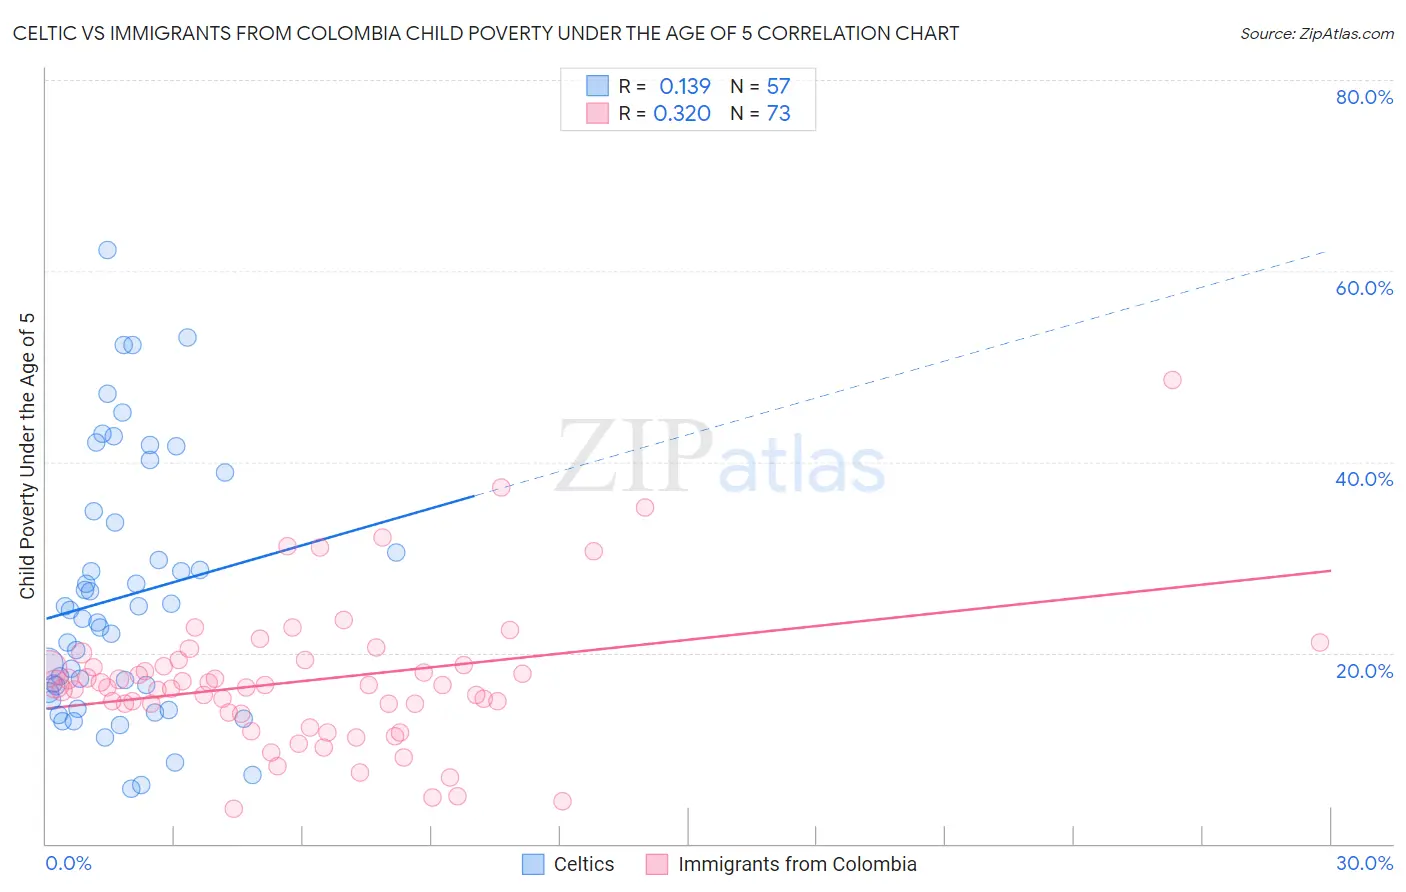
Celtic vs Immigrants from Colombia Child Poverty Under the Age of 5 Correlation Chart
The statistical analysis conducted on geographies consisting of 165,160,308 people shows a poor positive correlation between the proportion of Celtics and poverty level among children under the age of 5 in the United States with a correlation coefficient (R) of 0.139 and weighted average of 17.9%. Similarly, the statistical analysis conducted on geographies consisting of 364,956,826 people shows a mild positive correlation between the proportion of Immigrants from Colombia and poverty level among children under the age of 5 in the United States with a correlation coefficient (R) of 0.320 and weighted average of 16.9%, a difference of 5.8%.
Child Poverty Under the Age of 5 Correlation Summary
| Measurement | Celtic | Immigrants from Colombia |
| Minimum | 5.7% | 3.7% |
| Maximum | 62.3% | 48.6% |
| Range | 56.5% | 44.9% |
| Mean | 25.8% | 17.1% |
| Median | 23.6% | 16.6% |
| Interquartile 25% (IQ1) | 15.5% | 13.7% |
| Interquartile 75% (IQ3) | 34.3% | 19.0% |
| Interquartile Range (IQR) | 18.8% | 5.3% |
| Standard Deviation (Sample) | 13.4% | 7.6% |
| Standard Deviation (Population) | 13.3% | 7.5% |
Similar Demographics by Child Poverty Under the Age of 5
Demographics Similar to Celtics by Child Poverty Under the Age of 5
In terms of child poverty under the age of 5, the demographic groups most similar to Celtics are Hungarian (17.9%, a difference of 0.010%), Immigrants from Kenya (17.9%, a difference of 0.28%), Immigrants from Portugal (17.8%, a difference of 0.60%), Iraqi (18.0%, a difference of 0.81%), and Ugandan (18.0%, a difference of 0.82%).
| Demographics | Rating | Rank | Child Poverty Under the Age of 5 |
| Immigrants | Afghanistan | 27.9 /100 | #191 | Fair 17.7% |
| Immigrants | Uruguay | 27.8 /100 | #192 | Fair 17.7% |
| Immigrants | Uganda | 25.0 /100 | #193 | Fair 17.7% |
| French Canadians | 24.6 /100 | #194 | Fair 17.7% |
| Sierra Leoneans | 24.1 /100 | #195 | Fair 17.7% |
| Immigrants | Portugal | 22.2 /100 | #196 | Fair 17.8% |
| Immigrants | Kenya | 20.0 /100 | #197 | Fair 17.9% |
| Celtics | 18.3 /100 | #198 | Poor 17.9% |
| Hungarians | 18.3 /100 | #199 | Poor 17.9% |
| Iraqis | 14.0 /100 | #200 | Poor 18.0% |
| Ugandans | 13.9 /100 | #201 | Poor 18.0% |
| Japanese | 13.8 /100 | #202 | Poor 18.1% |
| Immigrants | Cambodia | 13.7 /100 | #203 | Poor 18.1% |
| Immigrants | Eastern Africa | 13.4 /100 | #204 | Poor 18.1% |
| Spaniards | 12.8 /100 | #205 | Poor 18.1% |
Demographics Similar to Immigrants from Colombia by Child Poverty Under the Age of 5
In terms of child poverty under the age of 5, the demographic groups most similar to Immigrants from Colombia are Immigrants from Oceania (16.9%, a difference of 0.090%), Scottish (16.9%, a difference of 0.21%), Slavic (17.0%, a difference of 0.34%), Costa Rican (16.9%, a difference of 0.36%), and English (16.8%, a difference of 0.43%).
| Demographics | Rating | Rank | Child Poverty Under the Age of 5 |
| Czechoslovakians | 72.5 /100 | #158 | Good 16.8% |
| Immigrants | Syria | 72.3 /100 | #159 | Good 16.8% |
| Irish | 72.0 /100 | #160 | Good 16.8% |
| English | 70.4 /100 | #161 | Good 16.8% |
| Costa Ricans | 69.8 /100 | #162 | Good 16.9% |
| Scottish | 68.6 /100 | #163 | Good 16.9% |
| Immigrants | Oceania | 67.6 /100 | #164 | Good 16.9% |
| Immigrants | Colombia | 66.9 /100 | #165 | Good 16.9% |
| Slavs | 64.0 /100 | #166 | Good 17.0% |
| Immigrants | Uzbekistan | 62.0 /100 | #167 | Good 17.0% |
| Uruguayans | 60.5 /100 | #168 | Good 17.0% |
| Immigrants | South America | 60.0 /100 | #169 | Good 17.1% |
| Immigrants | Western Asia | 59.2 /100 | #170 | Average 17.1% |
| Immigrants | Morocco | 58.9 /100 | #171 | Average 17.1% |
| Yugoslavians | 54.1 /100 | #172 | Average 17.2% |