Immigrants from Ghana vs Immigrants from Norway Child Poverty Among Boys Under 16
COMPARE
Immigrants from Ghana
Immigrants from Norway
Child Poverty Among Boys Under 16
Child Poverty Among Boys Under 16 Comparison
Immigrants from Ghana
Immigrants from Norway
19.4%
CHILD POVERTY AMONG BOYS UNDER 16
0.2/ 100
METRIC RATING
261st/ 347
METRIC RANK
15.3%
CHILD POVERTY AMONG BOYS UNDER 16
92.3/ 100
METRIC RATING
123rd/ 347
METRIC RANK
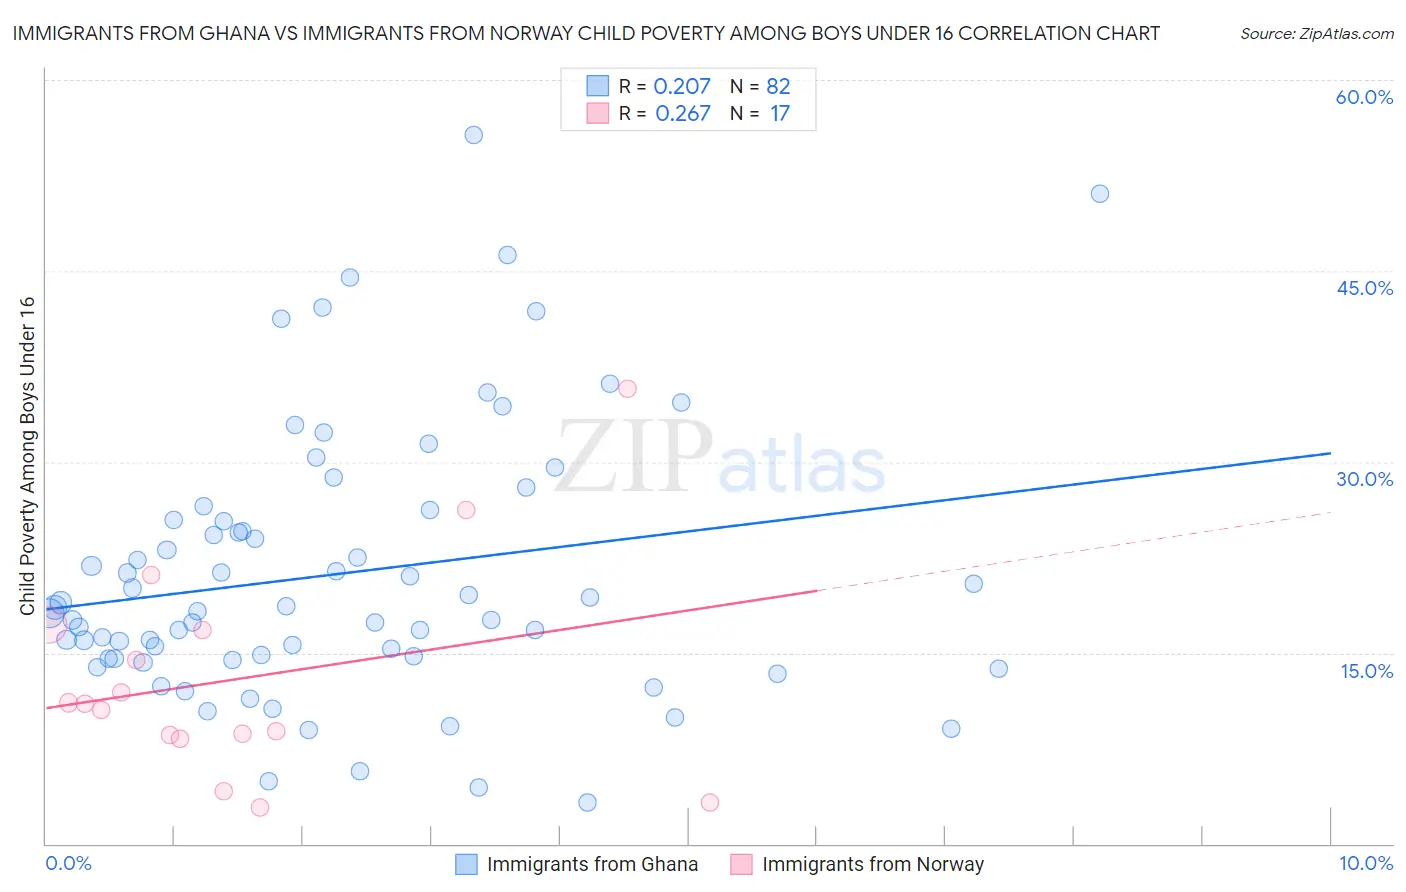
Immigrants from Ghana vs Immigrants from Norway Child Poverty Among Boys Under 16 Correlation Chart
The statistical analysis conducted on geographies consisting of 198,440,109 people shows a weak positive correlation between the proportion of Immigrants from Ghana and poverty level among boys under the age of 16 in the United States with a correlation coefficient (R) of 0.207 and weighted average of 19.4%. Similarly, the statistical analysis conducted on geographies consisting of 115,648,610 people shows a weak positive correlation between the proportion of Immigrants from Norway and poverty level among boys under the age of 16 in the United States with a correlation coefficient (R) of 0.267 and weighted average of 15.3%, a difference of 26.8%.
Child Poverty Among Boys Under 16 Correlation Summary
| Measurement | Immigrants from Ghana | Immigrants from Norway |
| Minimum | 3.2% | 2.9% |
| Maximum | 55.7% | 35.7% |
| Range | 52.4% | 32.8% |
| Mean | 21.2% | 13.0% |
| Median | 18.4% | 11.0% |
| Interquartile 25% (IQ1) | 14.6% | 8.4% |
| Interquartile 75% (IQ3) | 25.4% | 17.0% |
| Interquartile Range (IQR) | 10.8% | 8.6% |
| Standard Deviation (Sample) | 10.6% | 8.5% |
| Standard Deviation (Population) | 10.6% | 8.3% |
Similar Demographics by Child Poverty Among Boys Under 16
Demographics Similar to Immigrants from Ghana by Child Poverty Among Boys Under 16
In terms of child poverty among boys under 16, the demographic groups most similar to Immigrants from Ghana are Shoshone (19.4%, a difference of 0.010%), Spanish American (19.4%, a difference of 0.12%), Potawatomi (19.4%, a difference of 0.13%), Mexican American Indian (19.4%, a difference of 0.15%), and Immigrants from Guyana (19.5%, a difference of 0.32%).
| Demographics | Rating | Rank | Child Poverty Among Boys Under 16 |
| Trinidadians and Tobagonians | 0.2 /100 | #254 | Tragic 19.3% |
| Ecuadorians | 0.2 /100 | #255 | Tragic 19.3% |
| Immigrants | Liberia | 0.2 /100 | #256 | Tragic 19.3% |
| Mexican American Indians | 0.2 /100 | #257 | Tragic 19.4% |
| Potawatomi | 0.2 /100 | #258 | Tragic 19.4% |
| Spanish Americans | 0.2 /100 | #259 | Tragic 19.4% |
| Shoshone | 0.2 /100 | #260 | Tragic 19.4% |
| Immigrants | Ghana | 0.2 /100 | #261 | Tragic 19.4% |
| Immigrants | Guyana | 0.1 /100 | #262 | Tragic 19.5% |
| Ottawa | 0.1 /100 | #263 | Tragic 19.5% |
| Iroquois | 0.1 /100 | #264 | Tragic 19.6% |
| Guyanese | 0.1 /100 | #265 | Tragic 19.6% |
| Immigrants | El Salvador | 0.1 /100 | #266 | Tragic 19.6% |
| Vietnamese | 0.1 /100 | #267 | Tragic 19.6% |
| Spanish American Indians | 0.1 /100 | #268 | Tragic 19.6% |
Demographics Similar to Immigrants from Norway by Child Poverty Among Boys Under 16
In terms of child poverty among boys under 16, the demographic groups most similar to Immigrants from Norway are Tlingit-Haida (15.3%, a difference of 0.010%), Czechoslovakian (15.3%, a difference of 0.080%), Immigrants from Malaysia (15.3%, a difference of 0.22%), Scottish (15.2%, a difference of 0.32%), and South African (15.2%, a difference of 0.33%).
| Demographics | Rating | Rank | Child Poverty Among Boys Under 16 |
| Immigrants | South Eastern Asia | 93.5 /100 | #116 | Exceptional 15.2% |
| Immigrants | Vietnam | 93.5 /100 | #117 | Exceptional 15.2% |
| Native Hawaiians | 93.4 /100 | #118 | Exceptional 15.2% |
| Belgians | 93.1 /100 | #119 | Exceptional 15.2% |
| South Africans | 93.0 /100 | #120 | Exceptional 15.2% |
| Scottish | 93.0 /100 | #121 | Exceptional 15.2% |
| Immigrants | Malaysia | 92.8 /100 | #122 | Exceptional 15.3% |
| Immigrants | Norway | 92.3 /100 | #123 | Exceptional 15.3% |
| Tlingit-Haida | 92.2 /100 | #124 | Exceptional 15.3% |
| Czechoslovakians | 92.1 /100 | #125 | Exceptional 15.3% |
| Palestinians | 91.3 /100 | #126 | Exceptional 15.4% |
| Carpatho Rusyns | 91.1 /100 | #127 | Exceptional 15.4% |
| Canadians | 90.6 /100 | #128 | Exceptional 15.4% |
| Immigrants | Brazil | 90.3 /100 | #129 | Exceptional 15.4% |
| Mongolians | 90.2 /100 | #130 | Exceptional 15.4% |