Immigrants from Ghana vs Immigrants from Southern Europe Child Poverty Among Boys Under 16
COMPARE
Immigrants from Ghana
Immigrants from Southern Europe
Child Poverty Among Boys Under 16
Child Poverty Among Boys Under 16 Comparison
Immigrants from Ghana
Immigrants from Southern Europe
19.4%
CHILD POVERTY AMONG BOYS UNDER 16
0.2/ 100
METRIC RATING
261st/ 347
METRIC RANK
15.6%
CHILD POVERTY AMONG BOYS UNDER 16
86.5/ 100
METRIC RATING
138th/ 347
METRIC RANK
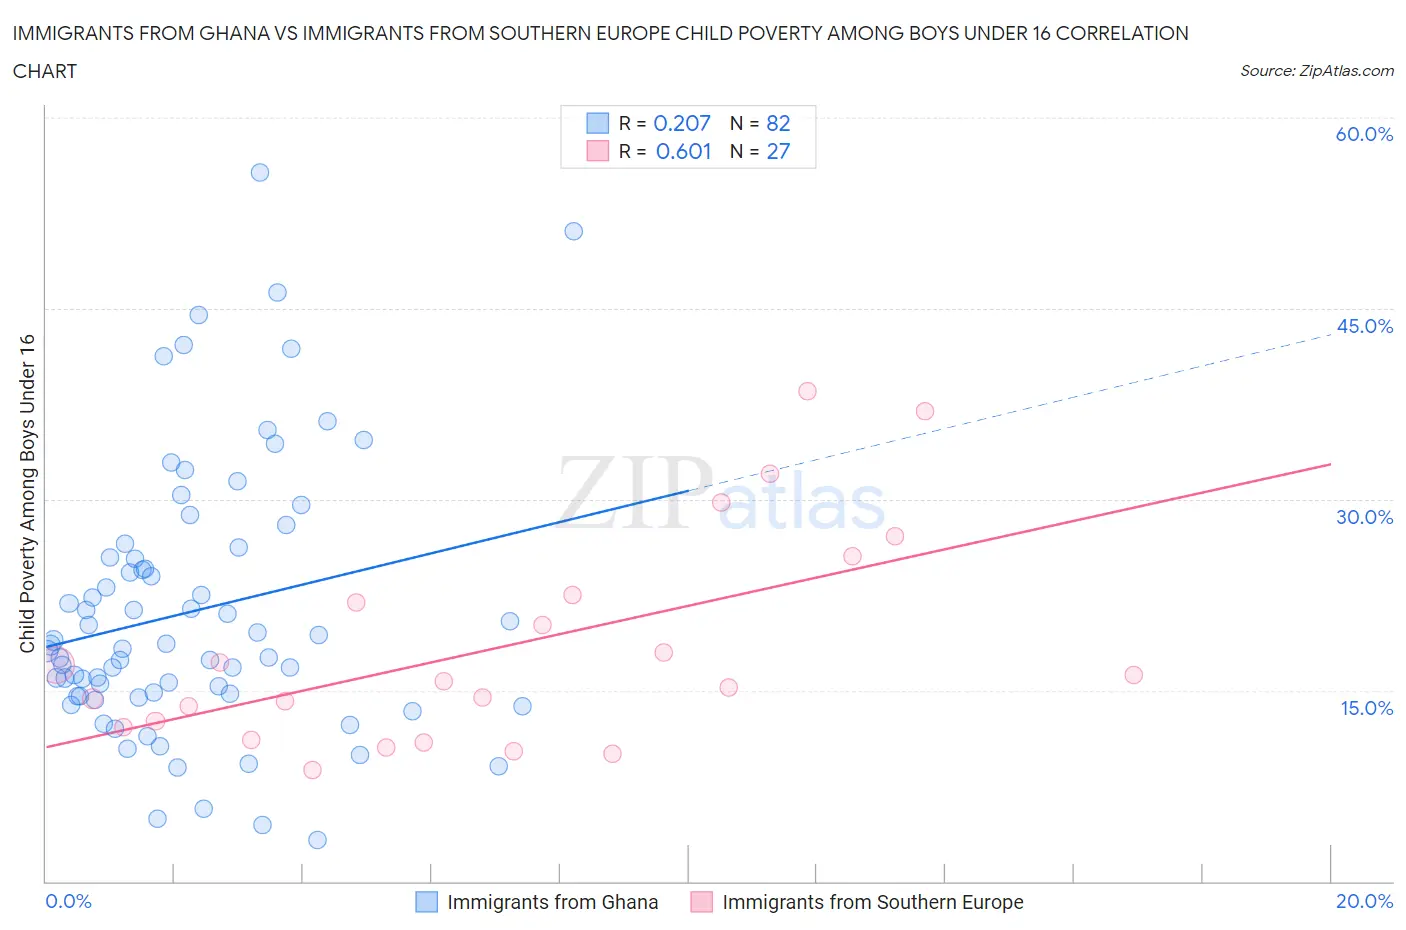
Immigrants from Ghana vs Immigrants from Southern Europe Child Poverty Among Boys Under 16 Correlation Chart
The statistical analysis conducted on geographies consisting of 198,440,109 people shows a weak positive correlation between the proportion of Immigrants from Ghana and poverty level among boys under the age of 16 in the United States with a correlation coefficient (R) of 0.207 and weighted average of 19.4%. Similarly, the statistical analysis conducted on geographies consisting of 393,933,079 people shows a significant positive correlation between the proportion of Immigrants from Southern Europe and poverty level among boys under the age of 16 in the United States with a correlation coefficient (R) of 0.601 and weighted average of 15.6%, a difference of 24.5%.
Child Poverty Among Boys Under 16 Correlation Summary
| Measurement | Immigrants from Ghana | Immigrants from Southern Europe |
| Minimum | 3.2% | 8.7% |
| Maximum | 55.7% | 38.5% |
| Range | 52.4% | 29.8% |
| Mean | 21.2% | 18.4% |
| Median | 18.4% | 15.7% |
| Interquartile 25% (IQ1) | 14.6% | 12.1% |
| Interquartile 75% (IQ3) | 25.4% | 22.5% |
| Interquartile Range (IQR) | 10.8% | 10.4% |
| Standard Deviation (Sample) | 10.6% | 8.3% |
| Standard Deviation (Population) | 10.6% | 8.1% |
Similar Demographics by Child Poverty Among Boys Under 16
Demographics Similar to Immigrants from Ghana by Child Poverty Among Boys Under 16
In terms of child poverty among boys under 16, the demographic groups most similar to Immigrants from Ghana are Shoshone (19.4%, a difference of 0.010%), Spanish American (19.4%, a difference of 0.12%), Potawatomi (19.4%, a difference of 0.13%), Mexican American Indian (19.4%, a difference of 0.15%), and Immigrants from Guyana (19.5%, a difference of 0.32%).
| Demographics | Rating | Rank | Child Poverty Among Boys Under 16 |
| Trinidadians and Tobagonians | 0.2 /100 | #254 | Tragic 19.3% |
| Ecuadorians | 0.2 /100 | #255 | Tragic 19.3% |
| Immigrants | Liberia | 0.2 /100 | #256 | Tragic 19.3% |
| Mexican American Indians | 0.2 /100 | #257 | Tragic 19.4% |
| Potawatomi | 0.2 /100 | #258 | Tragic 19.4% |
| Spanish Americans | 0.2 /100 | #259 | Tragic 19.4% |
| Shoshone | 0.2 /100 | #260 | Tragic 19.4% |
| Immigrants | Ghana | 0.2 /100 | #261 | Tragic 19.4% |
| Immigrants | Guyana | 0.1 /100 | #262 | Tragic 19.5% |
| Ottawa | 0.1 /100 | #263 | Tragic 19.5% |
| Iroquois | 0.1 /100 | #264 | Tragic 19.6% |
| Guyanese | 0.1 /100 | #265 | Tragic 19.6% |
| Immigrants | El Salvador | 0.1 /100 | #266 | Tragic 19.6% |
| Vietnamese | 0.1 /100 | #267 | Tragic 19.6% |
| Spanish American Indians | 0.1 /100 | #268 | Tragic 19.6% |
Demographics Similar to Immigrants from Southern Europe by Child Poverty Among Boys Under 16
In terms of child poverty among boys under 16, the demographic groups most similar to Immigrants from Southern Europe are Albanian (15.6%, a difference of 0.010%), Immigrants from Spain (15.6%, a difference of 0.15%), Immigrants from Kuwait (15.6%, a difference of 0.23%), Icelander (15.5%, a difference of 0.25%), and Portuguese (15.5%, a difference of 0.26%).
| Demographics | Rating | Rank | Child Poverty Among Boys Under 16 |
| Immigrants | Western Europe | 90.0 /100 | #131 | Exceptional 15.4% |
| Immigrants | Kazakhstan | 88.7 /100 | #132 | Excellent 15.5% |
| Welsh | 88.3 /100 | #133 | Excellent 15.5% |
| Peruvians | 88.1 /100 | #134 | Excellent 15.5% |
| Portuguese | 87.5 /100 | #135 | Excellent 15.5% |
| Icelanders | 87.5 /100 | #136 | Excellent 15.5% |
| Immigrants | Spain | 87.1 /100 | #137 | Excellent 15.6% |
| Immigrants | Southern Europe | 86.5 /100 | #138 | Excellent 15.6% |
| Albanians | 86.5 /100 | #139 | Excellent 15.6% |
| Immigrants | Kuwait | 85.6 /100 | #140 | Excellent 15.6% |
| Slavs | 84.5 /100 | #141 | Excellent 15.7% |
| Immigrants | Hungary | 84.1 /100 | #142 | Excellent 15.7% |
| Immigrants | Fiji | 83.6 /100 | #143 | Excellent 15.7% |
| Immigrants | Peru | 83.5 /100 | #144 | Excellent 15.7% |
| Samoans | 83.2 /100 | #145 | Excellent 15.7% |