Immigrants from Eastern Africa vs Immigrants from Norway Child Poverty Among Boys Under 16
COMPARE
Immigrants from Eastern Africa
Immigrants from Norway
Child Poverty Among Boys Under 16
Child Poverty Among Boys Under 16 Comparison
Immigrants from Eastern Africa
Immigrants from Norway
17.7%
CHILD POVERTY AMONG BOYS UNDER 16
6.0/ 100
METRIC RATING
213th/ 347
METRIC RANK
15.3%
CHILD POVERTY AMONG BOYS UNDER 16
92.3/ 100
METRIC RATING
123rd/ 347
METRIC RANK
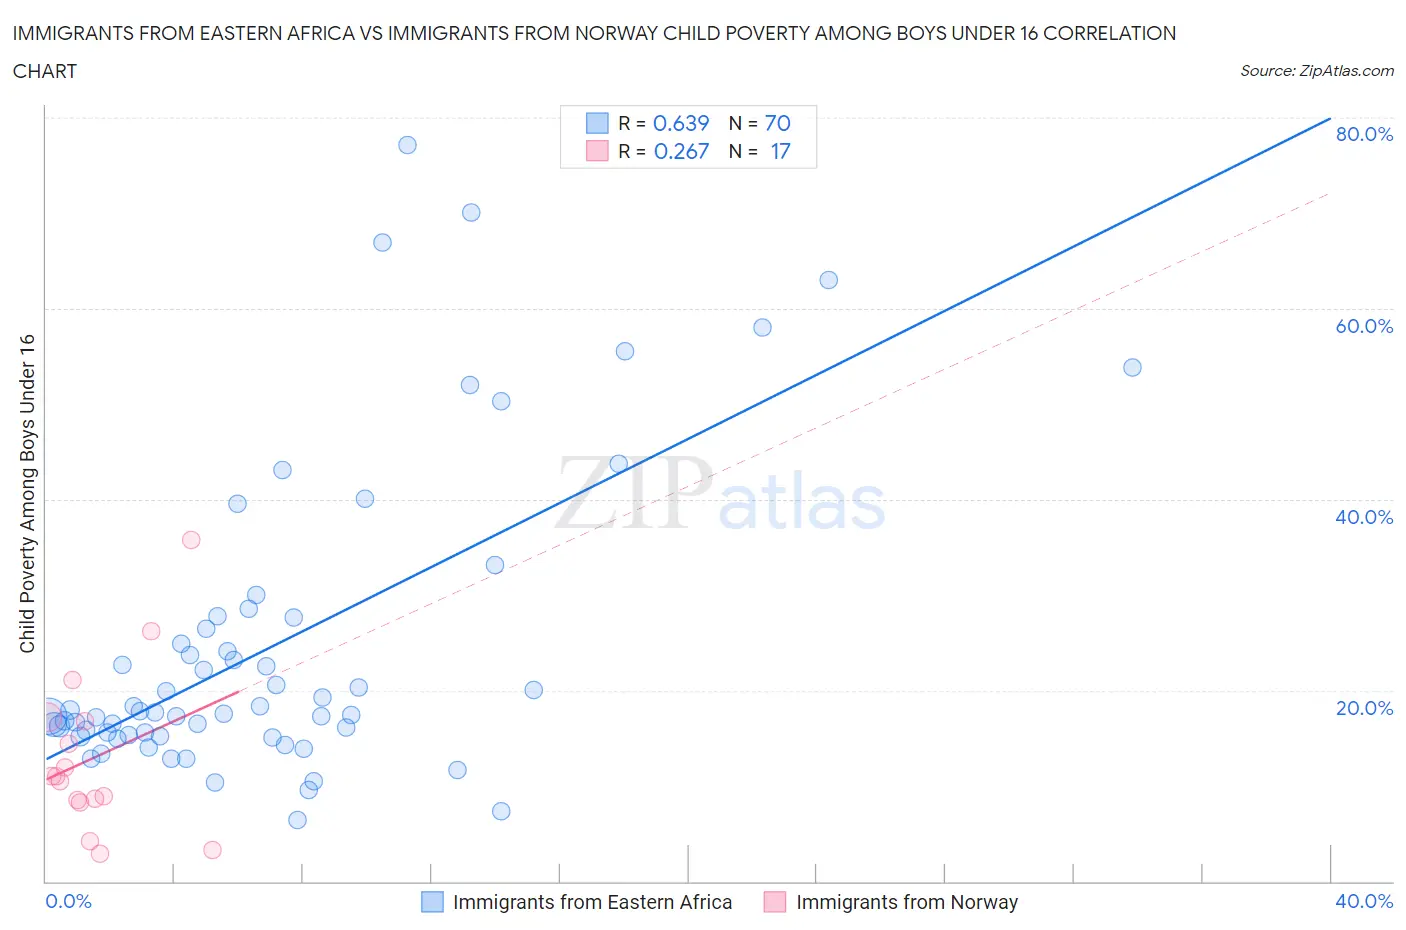
Immigrants from Eastern Africa vs Immigrants from Norway Child Poverty Among Boys Under 16 Correlation Chart
The statistical analysis conducted on geographies consisting of 350,926,284 people shows a significant positive correlation between the proportion of Immigrants from Eastern Africa and poverty level among boys under the age of 16 in the United States with a correlation coefficient (R) of 0.639 and weighted average of 17.7%. Similarly, the statistical analysis conducted on geographies consisting of 115,648,610 people shows a weak positive correlation between the proportion of Immigrants from Norway and poverty level among boys under the age of 16 in the United States with a correlation coefficient (R) of 0.267 and weighted average of 15.3%, a difference of 15.7%.
Child Poverty Among Boys Under 16 Correlation Summary
| Measurement | Immigrants from Eastern Africa | Immigrants from Norway |
| Minimum | 6.5% | 2.9% |
| Maximum | 77.2% | 35.7% |
| Range | 70.7% | 32.8% |
| Mean | 24.7% | 13.0% |
| Median | 17.7% | 11.0% |
| Interquartile 25% (IQ1) | 15.3% | 8.4% |
| Interquartile 75% (IQ3) | 27.6% | 17.0% |
| Interquartile Range (IQR) | 12.3% | 8.6% |
| Standard Deviation (Sample) | 16.1% | 8.5% |
| Standard Deviation (Population) | 16.0% | 8.3% |
Similar Demographics by Child Poverty Among Boys Under 16
Demographics Similar to Immigrants from Eastern Africa by Child Poverty Among Boys Under 16
In terms of child poverty among boys under 16, the demographic groups most similar to Immigrants from Eastern Africa are Panamanian (17.7%, a difference of 0.0%), Osage (17.7%, a difference of 0.080%), Moroccan (17.7%, a difference of 0.17%), Japanese (17.7%, a difference of 0.20%), and Iraqi (17.7%, a difference of 0.22%).
| Demographics | Rating | Rank | Child Poverty Among Boys Under 16 |
| German Russians | 10.9 /100 | #206 | Poor 17.4% |
| Immigrants | Thailand | 8.2 /100 | #207 | Tragic 17.5% |
| Malaysians | 7.6 /100 | #208 | Tragic 17.6% |
| Alaskan Athabascans | 7.3 /100 | #209 | Tragic 17.6% |
| Immigrants | Armenia | 6.8 /100 | #210 | Tragic 17.6% |
| Immigrants | Immigrants | 6.7 /100 | #211 | Tragic 17.6% |
| Aleuts | 6.6 /100 | #212 | Tragic 17.7% |
| Immigrants | Eastern Africa | 6.0 /100 | #213 | Tragic 17.7% |
| Panamanians | 5.9 /100 | #214 | Tragic 17.7% |
| Osage | 5.8 /100 | #215 | Tragic 17.7% |
| Moroccans | 5.6 /100 | #216 | Tragic 17.7% |
| Japanese | 5.5 /100 | #217 | Tragic 17.7% |
| Iraqis | 5.5 /100 | #218 | Tragic 17.7% |
| Sierra Leoneans | 5.3 /100 | #219 | Tragic 17.8% |
| Immigrants | Cambodia | 5.1 /100 | #220 | Tragic 17.8% |
Demographics Similar to Immigrants from Norway by Child Poverty Among Boys Under 16
In terms of child poverty among boys under 16, the demographic groups most similar to Immigrants from Norway are Tlingit-Haida (15.3%, a difference of 0.010%), Czechoslovakian (15.3%, a difference of 0.080%), Immigrants from Malaysia (15.3%, a difference of 0.22%), Scottish (15.2%, a difference of 0.32%), and South African (15.2%, a difference of 0.33%).
| Demographics | Rating | Rank | Child Poverty Among Boys Under 16 |
| Immigrants | South Eastern Asia | 93.5 /100 | #116 | Exceptional 15.2% |
| Immigrants | Vietnam | 93.5 /100 | #117 | Exceptional 15.2% |
| Native Hawaiians | 93.4 /100 | #118 | Exceptional 15.2% |
| Belgians | 93.1 /100 | #119 | Exceptional 15.2% |
| South Africans | 93.0 /100 | #120 | Exceptional 15.2% |
| Scottish | 93.0 /100 | #121 | Exceptional 15.2% |
| Immigrants | Malaysia | 92.8 /100 | #122 | Exceptional 15.3% |
| Immigrants | Norway | 92.3 /100 | #123 | Exceptional 15.3% |
| Tlingit-Haida | 92.2 /100 | #124 | Exceptional 15.3% |
| Czechoslovakians | 92.1 /100 | #125 | Exceptional 15.3% |
| Palestinians | 91.3 /100 | #126 | Exceptional 15.4% |
| Carpatho Rusyns | 91.1 /100 | #127 | Exceptional 15.4% |
| Canadians | 90.6 /100 | #128 | Exceptional 15.4% |
| Immigrants | Brazil | 90.3 /100 | #129 | Exceptional 15.4% |
| Mongolians | 90.2 /100 | #130 | Exceptional 15.4% |