Canadian vs Immigrants from Uganda Child Poverty Under the Age of 5
COMPARE
Canadian
Immigrants from Uganda
Child Poverty Under the Age of 5
Child Poverty Under the Age of 5 Comparison
Canadians
Immigrants from Uganda
16.7%
CHILD POVERTY UNDER THE AGE OF 5
77.6/ 100
METRIC RATING
151st/ 347
METRIC RANK
17.7%
CHILD POVERTY UNDER THE AGE OF 5
25.0/ 100
METRIC RATING
193rd/ 347
METRIC RANK
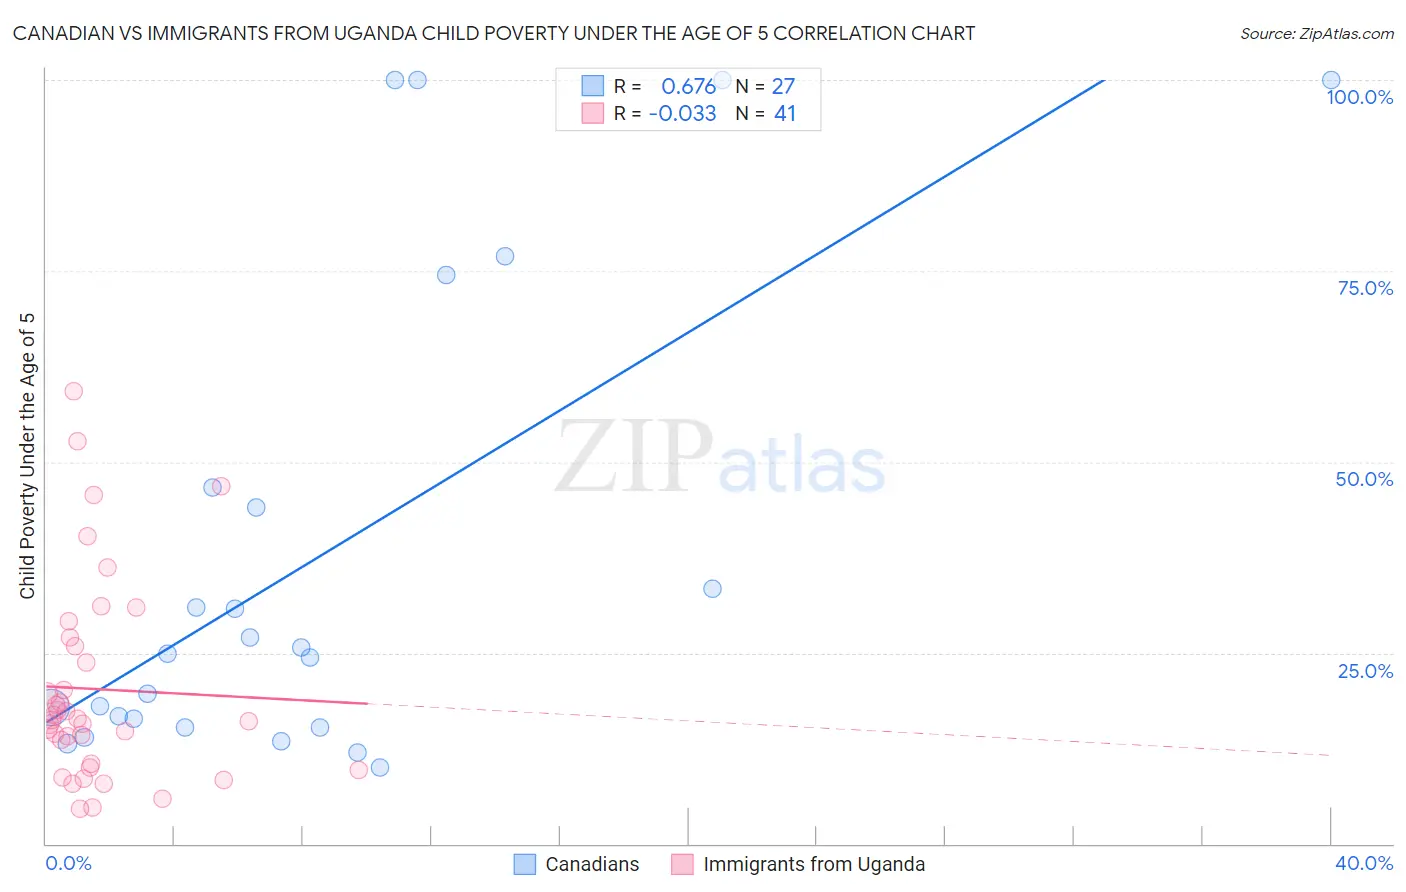
Canadian vs Immigrants from Uganda Child Poverty Under the Age of 5 Correlation Chart
The statistical analysis conducted on geographies consisting of 415,262,457 people shows a significant positive correlation between the proportion of Canadians and poverty level among children under the age of 5 in the United States with a correlation coefficient (R) of 0.676 and weighted average of 16.7%. Similarly, the statistical analysis conducted on geographies consisting of 124,022,230 people shows no correlation between the proportion of Immigrants from Uganda and poverty level among children under the age of 5 in the United States with a correlation coefficient (R) of -0.033 and weighted average of 17.7%, a difference of 6.3%.
Child Poverty Under the Age of 5 Correlation Summary
| Measurement | Canadian | Immigrants from Uganda |
| Minimum | 10.0% | 4.6% |
| Maximum | 100.0% | 59.2% |
| Range | 90.0% | 54.6% |
| Mean | 37.8% | 20.2% |
| Median | 24.9% | 16.2% |
| Interquartile 25% (IQ1) | 15.3% | 10.2% |
| Interquartile 75% (IQ3) | 46.6% | 26.4% |
| Interquartile Range (IQR) | 31.3% | 16.1% |
| Standard Deviation (Sample) | 31.3% | 13.3% |
| Standard Deviation (Population) | 30.7% | 13.1% |
Similar Demographics by Child Poverty Under the Age of 5
Demographics Similar to Canadians by Child Poverty Under the Age of 5
In terms of child poverty under the age of 5, the demographic groups most similar to Canadians are Colombian (16.7%, a difference of 0.030%), Belgian (16.7%, a difference of 0.060%), Dutch (16.7%, a difference of 0.080%), New Zealander (16.6%, a difference of 0.17%), and Syrian (16.6%, a difference of 0.23%).
| Demographics | Rating | Rank | Child Poverty Under the Age of 5 |
| Ethiopians | 82.7 /100 | #144 | Excellent 16.5% |
| Immigrants | Ethiopia | 82.1 /100 | #145 | Excellent 16.6% |
| Israelis | 82.0 /100 | #146 | Excellent 16.6% |
| Immigrants | Nepal | 80.3 /100 | #147 | Excellent 16.6% |
| Syrians | 79.1 /100 | #148 | Good 16.6% |
| New Zealanders | 78.7 /100 | #149 | Good 16.6% |
| Colombians | 77.8 /100 | #150 | Good 16.7% |
| Canadians | 77.6 /100 | #151 | Good 16.7% |
| Belgians | 77.2 /100 | #152 | Good 16.7% |
| Dutch | 77.1 /100 | #153 | Good 16.7% |
| Immigrants | Venezuela | 76.0 /100 | #154 | Good 16.7% |
| South Americans | 75.1 /100 | #155 | Good 16.7% |
| Afghans | 74.4 /100 | #156 | Good 16.8% |
| Venezuelans | 73.7 /100 | #157 | Good 16.8% |
| Czechoslovakians | 72.5 /100 | #158 | Good 16.8% |
Demographics Similar to Immigrants from Uganda by Child Poverty Under the Age of 5
In terms of child poverty under the age of 5, the demographic groups most similar to Immigrants from Uganda are French Canadian (17.7%, a difference of 0.060%), Sierra Leonean (17.7%, a difference of 0.12%), Immigrants from Afghanistan (17.7%, a difference of 0.37%), Immigrants from Uruguay (17.7%, a difference of 0.37%), and Immigrants from Portugal (17.8%, a difference of 0.39%).
| Demographics | Rating | Rank | Child Poverty Under the Age of 5 |
| Immigrants | Bosnia and Herzegovina | 35.0 /100 | #186 | Fair 17.5% |
| Kenyans | 34.7 /100 | #187 | Fair 17.5% |
| Carpatho Rusyns | 33.6 /100 | #188 | Fair 17.5% |
| French | 33.6 /100 | #189 | Fair 17.5% |
| Slovaks | 29.2 /100 | #190 | Fair 17.6% |
| Immigrants | Afghanistan | 27.9 /100 | #191 | Fair 17.7% |
| Immigrants | Uruguay | 27.8 /100 | #192 | Fair 17.7% |
| Immigrants | Uganda | 25.0 /100 | #193 | Fair 17.7% |
| French Canadians | 24.6 /100 | #194 | Fair 17.7% |
| Sierra Leoneans | 24.1 /100 | #195 | Fair 17.7% |
| Immigrants | Portugal | 22.2 /100 | #196 | Fair 17.8% |
| Immigrants | Kenya | 20.0 /100 | #197 | Fair 17.9% |
| Celtics | 18.3 /100 | #198 | Poor 17.9% |
| Hungarians | 18.3 /100 | #199 | Poor 17.9% |
| Iraqis | 14.0 /100 | #200 | Poor 18.0% |