Immigrants from France vs Delaware Female Poverty Among 25-34 Year Olds
COMPARE
Immigrants from France
Delaware
Female Poverty Among 25-34 Year Olds
Female Poverty Among 25-34 Year Olds Comparison
Immigrants from France
Delaware
12.6%
FEMALE POVERTY AMONG 25-34 YEAR OLDS
96.8/ 100
METRIC RATING
94th/ 347
METRIC RANK
14.6%
FEMALE POVERTY AMONG 25-34 YEAR OLDS
2.3/ 100
METRIC RATING
231st/ 347
METRIC RANK
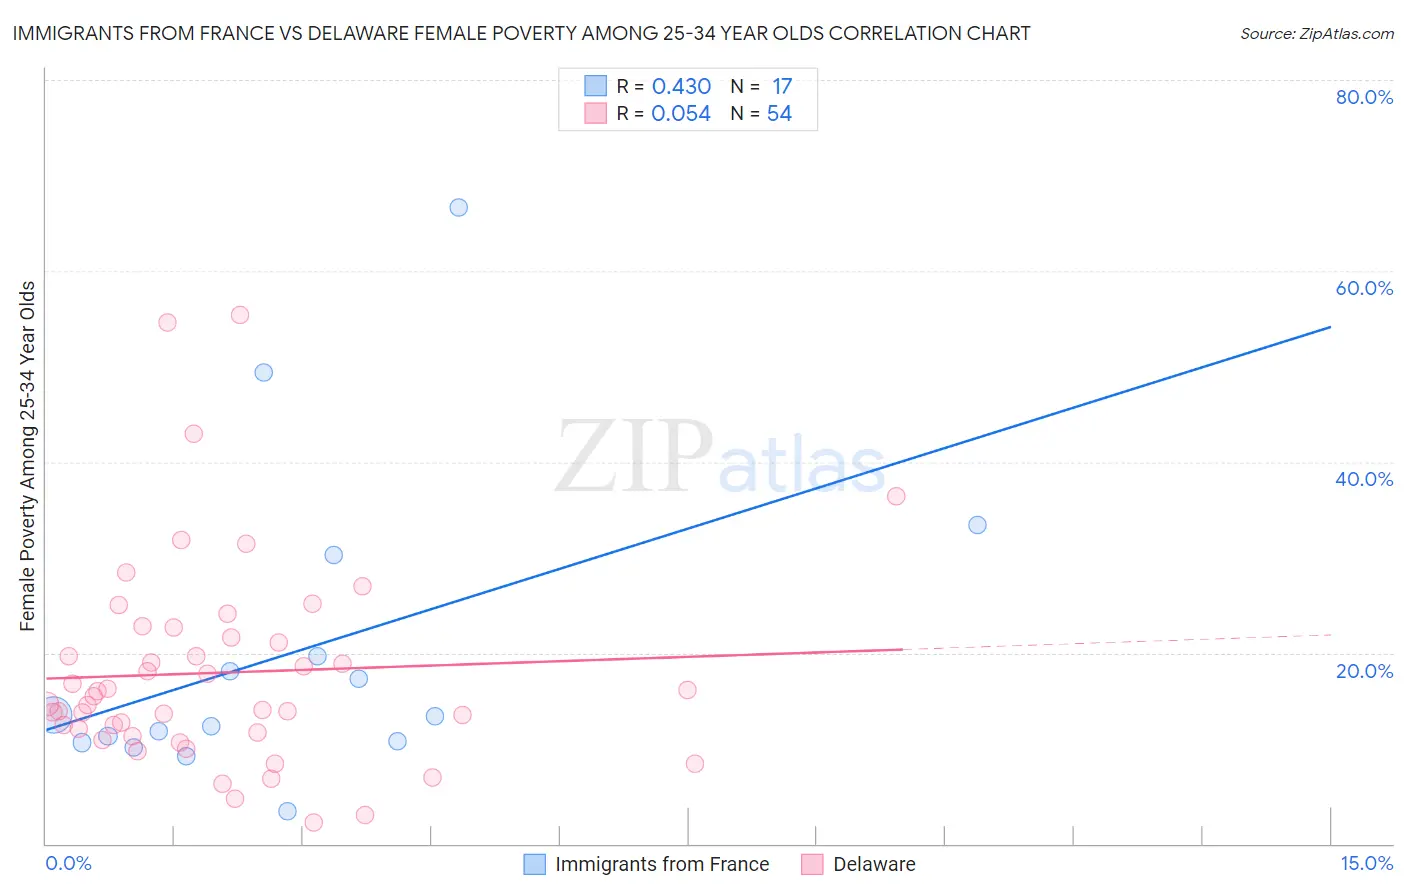
Immigrants from France vs Delaware Female Poverty Among 25-34 Year Olds Correlation Chart
The statistical analysis conducted on geographies consisting of 284,403,921 people shows a moderate positive correlation between the proportion of Immigrants from France and poverty level among females between the ages 25 and 34 in the United States with a correlation coefficient (R) of 0.430 and weighted average of 12.6%. Similarly, the statistical analysis conducted on geographies consisting of 95,672,726 people shows a slight positive correlation between the proportion of Delaware and poverty level among females between the ages 25 and 34 in the United States with a correlation coefficient (R) of 0.054 and weighted average of 14.6%, a difference of 16.0%.
Female Poverty Among 25-34 Year Olds Correlation Summary
| Measurement | Immigrants from France | Delaware |
| Minimum | 3.4% | 2.2% |
| Maximum | 66.7% | 55.4% |
| Range | 63.3% | 53.2% |
| Mean | 20.1% | 17.9% |
| Median | 13.3% | 15.1% |
| Interquartile 25% (IQ1) | 10.7% | 11.7% |
| Interquartile 75% (IQ3) | 24.9% | 21.6% |
| Interquartile Range (IQR) | 14.2% | 10.0% |
| Standard Deviation (Sample) | 16.4% | 10.9% |
| Standard Deviation (Population) | 15.9% | 10.8% |
Similar Demographics by Female Poverty Among 25-34 Year Olds
Demographics Similar to Immigrants from France by Female Poverty Among 25-34 Year Olds
In terms of female poverty among 25-34 year olds, the demographic groups most similar to Immigrants from France are Ukrainian (12.6%, a difference of 0.040%), Palestinian (12.6%, a difference of 0.050%), Immigrants from Zimbabwe (12.6%, a difference of 0.050%), Immigrants from Armenia (12.6%, a difference of 0.090%), and Norwegian (12.6%, a difference of 0.10%).
| Demographics | Rating | Rank | Female Poverty Among 25-34 Year Olds |
| Argentineans | 97.5 /100 | #87 | Exceptional 12.5% |
| Immigrants | Austria | 97.4 /100 | #88 | Exceptional 12.5% |
| Italians | 97.2 /100 | #89 | Exceptional 12.5% |
| Immigrants | Albania | 97.1 /100 | #90 | Exceptional 12.5% |
| Norwegians | 96.9 /100 | #91 | Exceptional 12.6% |
| Immigrants | Armenia | 96.9 /100 | #92 | Exceptional 12.6% |
| Palestinians | 96.9 /100 | #93 | Exceptional 12.6% |
| Immigrants | France | 96.8 /100 | #94 | Exceptional 12.6% |
| Ukrainians | 96.7 /100 | #95 | Exceptional 12.6% |
| Immigrants | Zimbabwe | 96.7 /100 | #96 | Exceptional 12.6% |
| Immigrants | Northern Africa | 96.6 /100 | #97 | Exceptional 12.6% |
| Immigrants | Ethiopia | 96.5 /100 | #98 | Exceptional 12.6% |
| Immigrants | Argentina | 96.4 /100 | #99 | Exceptional 12.6% |
| Immigrants | Denmark | 95.7 /100 | #100 | Exceptional 12.7% |
| Immigrants | Switzerland | 95.7 /100 | #101 | Exceptional 12.7% |
Demographics Similar to Delaware by Female Poverty Among 25-34 Year Olds
In terms of female poverty among 25-34 year olds, the demographic groups most similar to Delaware are Spaniard (14.6%, a difference of 0.040%), Spanish (14.6%, a difference of 0.18%), Vietnamese (14.6%, a difference of 0.27%), Immigrants from Ecuador (14.6%, a difference of 0.31%), and Celtic (14.5%, a difference of 0.45%).
| Demographics | Rating | Rank | Female Poverty Among 25-34 Year Olds |
| Immigrants | Sudan | 4.0 /100 | #224 | Tragic 14.4% |
| Immigrants | Barbados | 3.4 /100 | #225 | Tragic 14.5% |
| Nicaraguans | 3.3 /100 | #226 | Tragic 14.5% |
| Celtics | 2.8 /100 | #227 | Tragic 14.5% |
| Vietnamese | 2.6 /100 | #228 | Tragic 14.6% |
| Spanish | 2.5 /100 | #229 | Tragic 14.6% |
| Spaniards | 2.3 /100 | #230 | Tragic 14.6% |
| Delaware | 2.3 /100 | #231 | Tragic 14.6% |
| Immigrants | Ecuador | 1.9 /100 | #232 | Tragic 14.6% |
| Whites/Caucasians | 1.8 /100 | #233 | Tragic 14.7% |
| Cubans | 1.6 /100 | #234 | Tragic 14.7% |
| Immigrants | Jamaica | 1.4 /100 | #235 | Tragic 14.7% |
| Salvadorans | 1.4 /100 | #236 | Tragic 14.7% |
| Immigrants | Ghana | 1.4 /100 | #237 | Tragic 14.7% |
| Alsatians | 1.4 /100 | #238 | Tragic 14.7% |