Immigrants from France vs Japanese Female Poverty Among 25-34 Year Olds
COMPARE
Immigrants from France
Japanese
Female Poverty Among 25-34 Year Olds
Female Poverty Among 25-34 Year Olds Comparison
Immigrants from France
Japanese
12.6%
FEMALE POVERTY AMONG 25-34 YEAR OLDS
96.8/ 100
METRIC RATING
94th/ 347
METRIC RANK
14.1%
FEMALE POVERTY AMONG 25-34 YEAR OLDS
11.7/ 100
METRIC RATING
207th/ 347
METRIC RANK
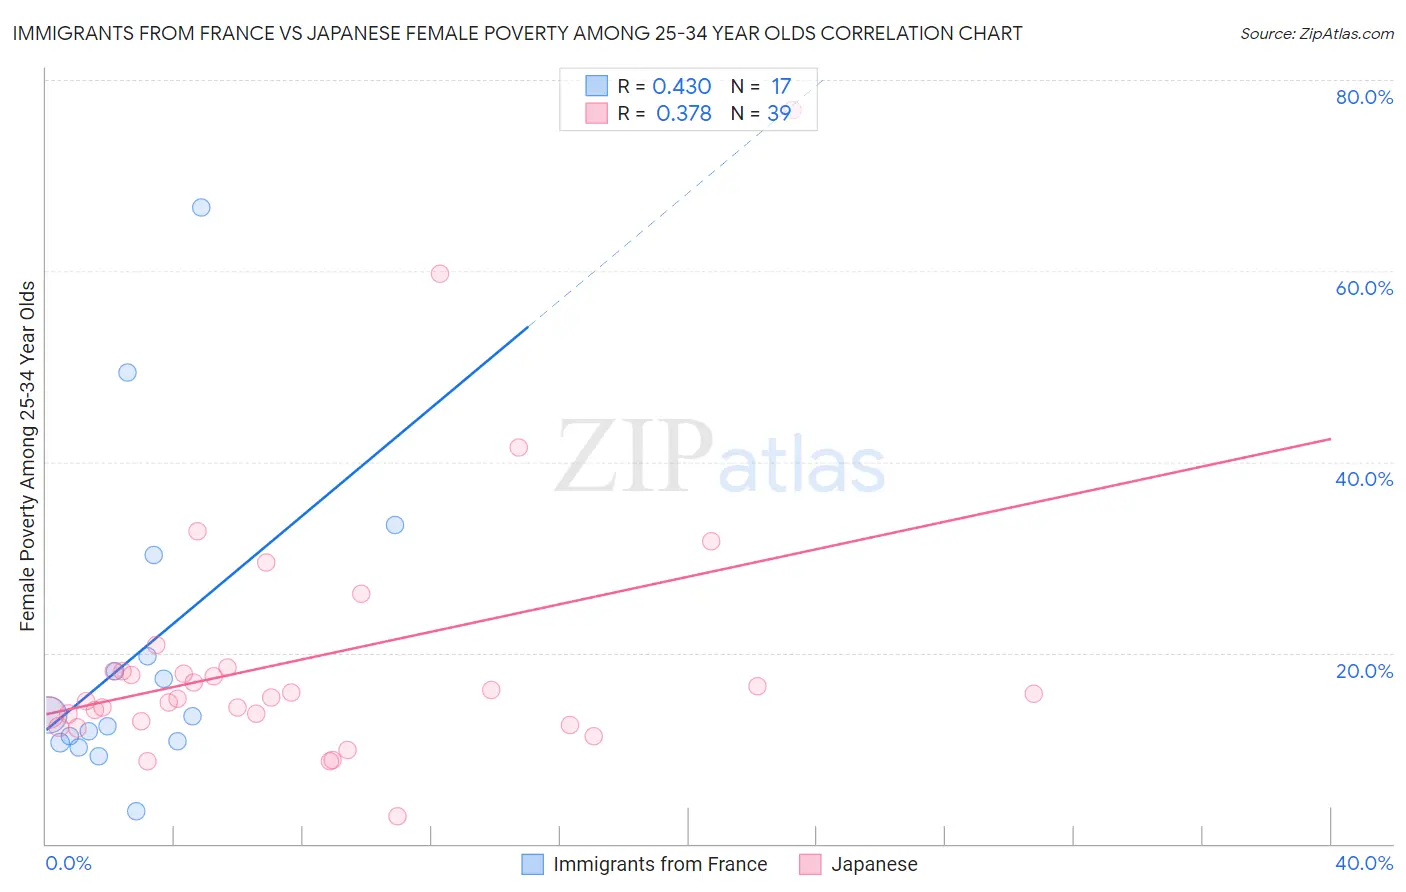
Immigrants from France vs Japanese Female Poverty Among 25-34 Year Olds Correlation Chart
The statistical analysis conducted on geographies consisting of 284,403,921 people shows a moderate positive correlation between the proportion of Immigrants from France and poverty level among females between the ages 25 and 34 in the United States with a correlation coefficient (R) of 0.430 and weighted average of 12.6%. Similarly, the statistical analysis conducted on geographies consisting of 247,459,659 people shows a mild positive correlation between the proportion of Japanese and poverty level among females between the ages 25 and 34 in the United States with a correlation coefficient (R) of 0.378 and weighted average of 14.1%, a difference of 12.1%.
Female Poverty Among 25-34 Year Olds Correlation Summary
| Measurement | Immigrants from France | Japanese |
| Minimum | 3.4% | 2.8% |
| Maximum | 66.7% | 76.9% |
| Range | 63.3% | 74.1% |
| Mean | 20.1% | 19.3% |
| Median | 13.3% | 15.3% |
| Interquartile 25% (IQ1) | 10.7% | 12.8% |
| Interquartile 75% (IQ3) | 24.9% | 18.1% |
| Interquartile Range (IQR) | 14.2% | 5.3% |
| Standard Deviation (Sample) | 16.4% | 13.8% |
| Standard Deviation (Population) | 15.9% | 13.6% |
Similar Demographics by Female Poverty Among 25-34 Year Olds
Demographics Similar to Immigrants from France by Female Poverty Among 25-34 Year Olds
In terms of female poverty among 25-34 year olds, the demographic groups most similar to Immigrants from France are Ukrainian (12.6%, a difference of 0.040%), Palestinian (12.6%, a difference of 0.050%), Immigrants from Zimbabwe (12.6%, a difference of 0.050%), Immigrants from Armenia (12.6%, a difference of 0.090%), and Norwegian (12.6%, a difference of 0.10%).
| Demographics | Rating | Rank | Female Poverty Among 25-34 Year Olds |
| Argentineans | 97.5 /100 | #87 | Exceptional 12.5% |
| Immigrants | Austria | 97.4 /100 | #88 | Exceptional 12.5% |
| Italians | 97.2 /100 | #89 | Exceptional 12.5% |
| Immigrants | Albania | 97.1 /100 | #90 | Exceptional 12.5% |
| Norwegians | 96.9 /100 | #91 | Exceptional 12.6% |
| Immigrants | Armenia | 96.9 /100 | #92 | Exceptional 12.6% |
| Palestinians | 96.9 /100 | #93 | Exceptional 12.6% |
| Immigrants | France | 96.8 /100 | #94 | Exceptional 12.6% |
| Ukrainians | 96.7 /100 | #95 | Exceptional 12.6% |
| Immigrants | Zimbabwe | 96.7 /100 | #96 | Exceptional 12.6% |
| Immigrants | Northern Africa | 96.6 /100 | #97 | Exceptional 12.6% |
| Immigrants | Ethiopia | 96.5 /100 | #98 | Exceptional 12.6% |
| Immigrants | Argentina | 96.4 /100 | #99 | Exceptional 12.6% |
| Immigrants | Denmark | 95.7 /100 | #100 | Exceptional 12.7% |
| Immigrants | Switzerland | 95.7 /100 | #101 | Exceptional 12.7% |
Demographics Similar to Japanese by Female Poverty Among 25-34 Year Olds
In terms of female poverty among 25-34 year olds, the demographic groups most similar to Japanese are Hungarian (14.1%, a difference of 0.020%), Immigrants from Panama (14.1%, a difference of 0.020%), Immigrants from Africa (14.1%, a difference of 0.30%), Hawaiian (14.1%, a difference of 0.35%), and Immigrants (14.0%, a difference of 0.49%).
| Demographics | Rating | Rank | Female Poverty Among 25-34 Year Olds |
| Hmong | 20.3 /100 | #200 | Fair 13.9% |
| Immigrants | Trinidad and Tobago | 17.6 /100 | #201 | Poor 14.0% |
| Welsh | 17.2 /100 | #202 | Poor 14.0% |
| Immigrants | Immigrants | 14.5 /100 | #203 | Poor 14.0% |
| Hawaiians | 13.6 /100 | #204 | Poor 14.1% |
| Immigrants | Africa | 13.4 /100 | #205 | Poor 14.1% |
| Hungarians | 11.8 /100 | #206 | Poor 14.1% |
| Japanese | 11.7 /100 | #207 | Poor 14.1% |
| Immigrants | Panama | 11.6 /100 | #208 | Poor 14.1% |
| Guyanese | 8.6 /100 | #209 | Tragic 14.2% |
| Panamanians | 8.6 /100 | #210 | Tragic 14.2% |
| Trinidadians and Tobagonians | 8.2 /100 | #211 | Tragic 14.2% |
| Immigrants | Guyana | 6.6 /100 | #212 | Tragic 14.3% |
| Puget Sound Salish | 6.5 /100 | #213 | Tragic 14.3% |
| French | 6.2 /100 | #214 | Tragic 14.3% |