Immigrants from France vs Ghanaian Female Poverty Among 25-34 Year Olds
COMPARE
Immigrants from France
Ghanaian
Female Poverty Among 25-34 Year Olds
Female Poverty Among 25-34 Year Olds Comparison
Immigrants from France
Ghanaians
12.6%
FEMALE POVERTY AMONG 25-34 YEAR OLDS
96.8/ 100
METRIC RATING
94th/ 347
METRIC RANK
14.4%
FEMALE POVERTY AMONG 25-34 YEAR OLDS
4.8/ 100
METRIC RATING
220th/ 347
METRIC RANK
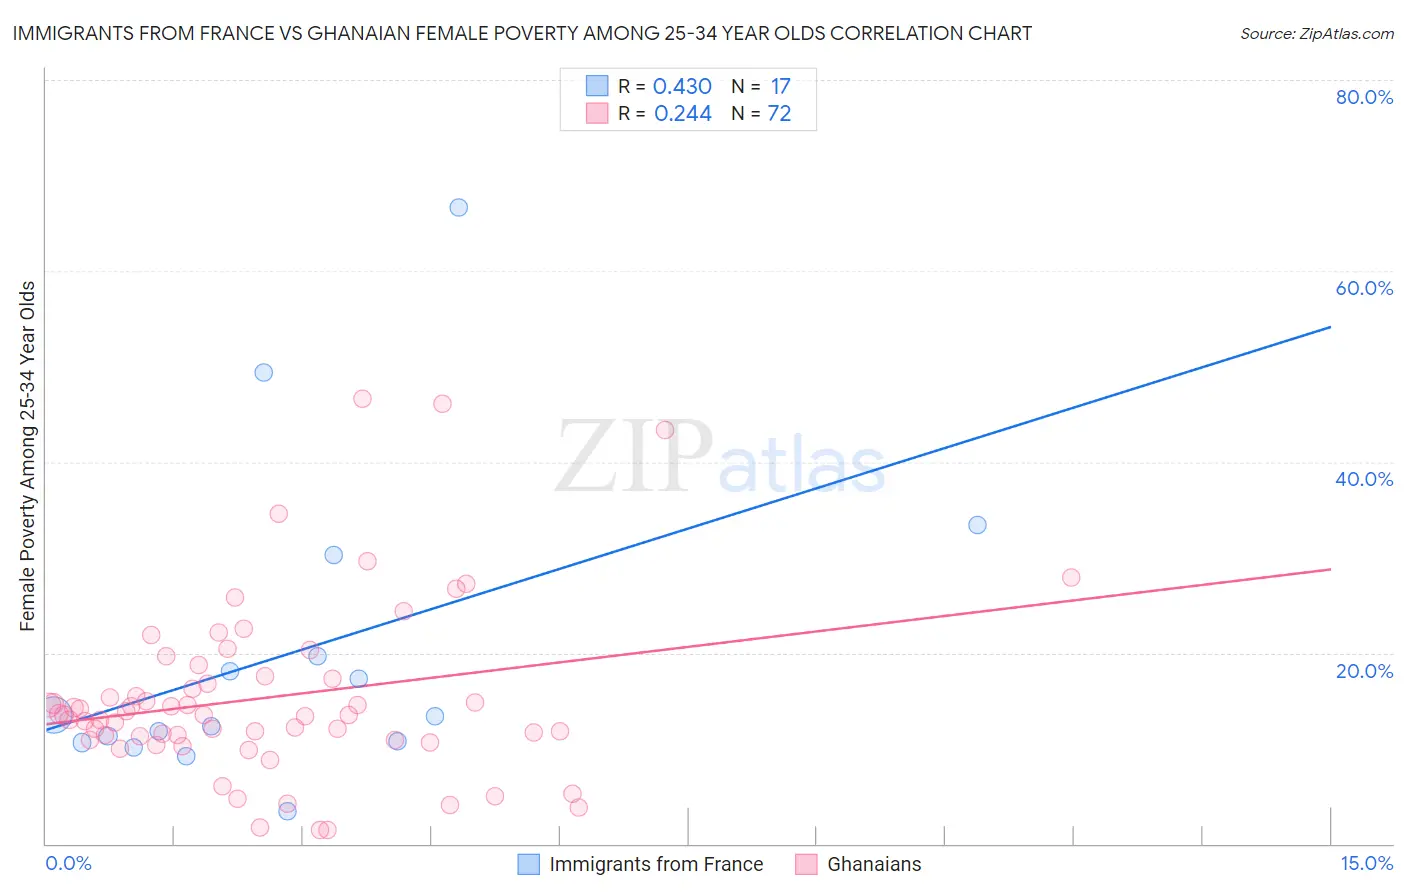
Immigrants from France vs Ghanaian Female Poverty Among 25-34 Year Olds Correlation Chart
The statistical analysis conducted on geographies consisting of 284,403,921 people shows a moderate positive correlation between the proportion of Immigrants from France and poverty level among females between the ages 25 and 34 in the United States with a correlation coefficient (R) of 0.430 and weighted average of 12.6%. Similarly, the statistical analysis conducted on geographies consisting of 189,437,632 people shows a weak positive correlation between the proportion of Ghanaians and poverty level among females between the ages 25 and 34 in the United States with a correlation coefficient (R) of 0.244 and weighted average of 14.4%, a difference of 14.3%.
Female Poverty Among 25-34 Year Olds Correlation Summary
| Measurement | Immigrants from France | Ghanaian |
| Minimum | 3.4% | 1.4% |
| Maximum | 66.7% | 46.7% |
| Range | 63.3% | 45.2% |
| Mean | 20.1% | 15.3% |
| Median | 13.3% | 13.5% |
| Interquartile 25% (IQ1) | 10.7% | 11.1% |
| Interquartile 75% (IQ3) | 24.9% | 17.4% |
| Interquartile Range (IQR) | 14.2% | 6.3% |
| Standard Deviation (Sample) | 16.4% | 9.1% |
| Standard Deviation (Population) | 15.9% | 9.1% |
Similar Demographics by Female Poverty Among 25-34 Year Olds
Demographics Similar to Immigrants from France by Female Poverty Among 25-34 Year Olds
In terms of female poverty among 25-34 year olds, the demographic groups most similar to Immigrants from France are Ukrainian (12.6%, a difference of 0.040%), Palestinian (12.6%, a difference of 0.050%), Immigrants from Zimbabwe (12.6%, a difference of 0.050%), Immigrants from Armenia (12.6%, a difference of 0.090%), and Norwegian (12.6%, a difference of 0.10%).
| Demographics | Rating | Rank | Female Poverty Among 25-34 Year Olds |
| Argentineans | 97.5 /100 | #87 | Exceptional 12.5% |
| Immigrants | Austria | 97.4 /100 | #88 | Exceptional 12.5% |
| Italians | 97.2 /100 | #89 | Exceptional 12.5% |
| Immigrants | Albania | 97.1 /100 | #90 | Exceptional 12.5% |
| Norwegians | 96.9 /100 | #91 | Exceptional 12.6% |
| Immigrants | Armenia | 96.9 /100 | #92 | Exceptional 12.6% |
| Palestinians | 96.9 /100 | #93 | Exceptional 12.6% |
| Immigrants | France | 96.8 /100 | #94 | Exceptional 12.6% |
| Ukrainians | 96.7 /100 | #95 | Exceptional 12.6% |
| Immigrants | Zimbabwe | 96.7 /100 | #96 | Exceptional 12.6% |
| Immigrants | Northern Africa | 96.6 /100 | #97 | Exceptional 12.6% |
| Immigrants | Ethiopia | 96.5 /100 | #98 | Exceptional 12.6% |
| Immigrants | Argentina | 96.4 /100 | #99 | Exceptional 12.6% |
| Immigrants | Denmark | 95.7 /100 | #100 | Exceptional 12.7% |
| Immigrants | Switzerland | 95.7 /100 | #101 | Exceptional 12.7% |
Demographics Similar to Ghanaians by Female Poverty Among 25-34 Year Olds
In terms of female poverty among 25-34 year olds, the demographic groups most similar to Ghanaians are Sudanese (14.4%, a difference of 0.15%), Ecuadorian (14.3%, a difference of 0.16%), Immigrants from Thailand (14.3%, a difference of 0.17%), Immigrants from Portugal (14.4%, a difference of 0.22%), and French Canadian (14.3%, a difference of 0.28%).
| Demographics | Rating | Rank | Female Poverty Among 25-34 Year Olds |
| Puget Sound Salish | 6.5 /100 | #213 | Tragic 14.3% |
| French | 6.2 /100 | #214 | Tragic 14.3% |
| Immigrants | Nigeria | 6.2 /100 | #215 | Tragic 14.3% |
| French Canadians | 5.5 /100 | #216 | Tragic 14.3% |
| Spanish American Indians | 5.5 /100 | #217 | Tragic 14.3% |
| Immigrants | Thailand | 5.2 /100 | #218 | Tragic 14.3% |
| Ecuadorians | 5.2 /100 | #219 | Tragic 14.3% |
| Ghanaians | 4.8 /100 | #220 | Tragic 14.4% |
| Sudanese | 4.4 /100 | #221 | Tragic 14.4% |
| Immigrants | Portugal | 4.3 /100 | #222 | Tragic 14.4% |
| Nigerians | 4.2 /100 | #223 | Tragic 14.4% |
| Immigrants | Sudan | 4.0 /100 | #224 | Tragic 14.4% |
| Immigrants | Barbados | 3.4 /100 | #225 | Tragic 14.5% |
| Nicaraguans | 3.3 /100 | #226 | Tragic 14.5% |
| Celtics | 2.8 /100 | #227 | Tragic 14.5% |