Salvadoran vs Japanese Female Poverty Among 25-34 Year Olds
COMPARE
Salvadoran
Japanese
Female Poverty Among 25-34 Year Olds
Female Poverty Among 25-34 Year Olds Comparison
Salvadorans
Japanese
14.7%
FEMALE POVERTY AMONG 25-34 YEAR OLDS
1.4/ 100
METRIC RATING
236th/ 347
METRIC RANK
14.1%
FEMALE POVERTY AMONG 25-34 YEAR OLDS
11.7/ 100
METRIC RATING
207th/ 347
METRIC RANK
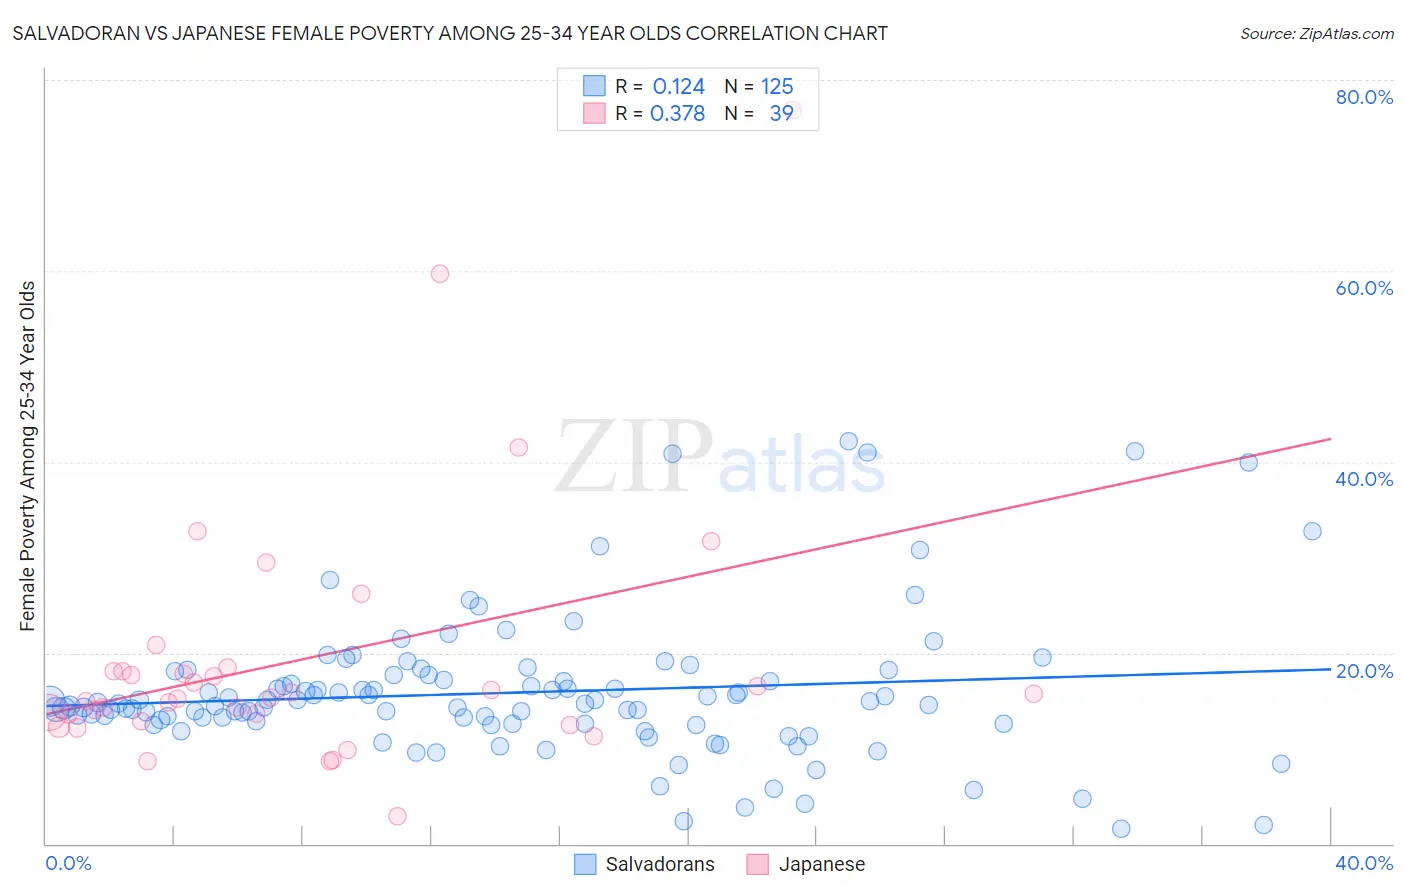
Salvadoran vs Japanese Female Poverty Among 25-34 Year Olds Correlation Chart
The statistical analysis conducted on geographies consisting of 394,044,278 people shows a poor positive correlation between the proportion of Salvadorans and poverty level among females between the ages 25 and 34 in the United States with a correlation coefficient (R) of 0.124 and weighted average of 14.7%. Similarly, the statistical analysis conducted on geographies consisting of 247,459,659 people shows a mild positive correlation between the proportion of Japanese and poverty level among females between the ages 25 and 34 in the United States with a correlation coefficient (R) of 0.378 and weighted average of 14.1%, a difference of 4.4%.
Female Poverty Among 25-34 Year Olds Correlation Summary
| Measurement | Salvadoran | Japanese |
| Minimum | 1.5% | 2.8% |
| Maximum | 42.2% | 76.9% |
| Range | 40.7% | 74.1% |
| Mean | 15.8% | 19.3% |
| Median | 14.7% | 15.3% |
| Interquartile 25% (IQ1) | 12.6% | 12.8% |
| Interquartile 75% (IQ3) | 17.4% | 18.1% |
| Interquartile Range (IQR) | 4.8% | 5.3% |
| Standard Deviation (Sample) | 7.4% | 13.8% |
| Standard Deviation (Population) | 7.3% | 13.6% |
Similar Demographics by Female Poverty Among 25-34 Year Olds
Demographics Similar to Salvadorans by Female Poverty Among 25-34 Year Olds
In terms of female poverty among 25-34 year olds, the demographic groups most similar to Salvadorans are Immigrants from Ghana (14.7%, a difference of 0.0%), Immigrants from Jamaica (14.7%, a difference of 0.020%), Alsatian (14.7%, a difference of 0.040%), Malaysian (14.7%, a difference of 0.070%), and Immigrants from Grenada (14.7%, a difference of 0.12%).
| Demographics | Rating | Rank | Female Poverty Among 25-34 Year Olds |
| Spanish | 2.5 /100 | #229 | Tragic 14.6% |
| Spaniards | 2.3 /100 | #230 | Tragic 14.6% |
| Delaware | 2.3 /100 | #231 | Tragic 14.6% |
| Immigrants | Ecuador | 1.9 /100 | #232 | Tragic 14.6% |
| Whites/Caucasians | 1.8 /100 | #233 | Tragic 14.7% |
| Cubans | 1.6 /100 | #234 | Tragic 14.7% |
| Immigrants | Jamaica | 1.4 /100 | #235 | Tragic 14.7% |
| Salvadorans | 1.4 /100 | #236 | Tragic 14.7% |
| Immigrants | Ghana | 1.4 /100 | #237 | Tragic 14.7% |
| Alsatians | 1.4 /100 | #238 | Tragic 14.7% |
| Malaysians | 1.4 /100 | #239 | Tragic 14.7% |
| Immigrants | Grenada | 1.3 /100 | #240 | Tragic 14.7% |
| Scotch-Irish | 1.2 /100 | #241 | Tragic 14.8% |
| Barbadians | 1.2 /100 | #242 | Tragic 14.8% |
| Immigrants | Nicaragua | 1.1 /100 | #243 | Tragic 14.8% |
Demographics Similar to Japanese by Female Poverty Among 25-34 Year Olds
In terms of female poverty among 25-34 year olds, the demographic groups most similar to Japanese are Hungarian (14.1%, a difference of 0.020%), Immigrants from Panama (14.1%, a difference of 0.020%), Immigrants from Africa (14.1%, a difference of 0.30%), Hawaiian (14.1%, a difference of 0.35%), and Immigrants (14.0%, a difference of 0.49%).
| Demographics | Rating | Rank | Female Poverty Among 25-34 Year Olds |
| Hmong | 20.3 /100 | #200 | Fair 13.9% |
| Immigrants | Trinidad and Tobago | 17.6 /100 | #201 | Poor 14.0% |
| Welsh | 17.2 /100 | #202 | Poor 14.0% |
| Immigrants | Immigrants | 14.5 /100 | #203 | Poor 14.0% |
| Hawaiians | 13.6 /100 | #204 | Poor 14.1% |
| Immigrants | Africa | 13.4 /100 | #205 | Poor 14.1% |
| Hungarians | 11.8 /100 | #206 | Poor 14.1% |
| Japanese | 11.7 /100 | #207 | Poor 14.1% |
| Immigrants | Panama | 11.6 /100 | #208 | Poor 14.1% |
| Guyanese | 8.6 /100 | #209 | Tragic 14.2% |
| Panamanians | 8.6 /100 | #210 | Tragic 14.2% |
| Trinidadians and Tobagonians | 8.2 /100 | #211 | Tragic 14.2% |
| Immigrants | Guyana | 6.6 /100 | #212 | Tragic 14.3% |
| Puget Sound Salish | 6.5 /100 | #213 | Tragic 14.3% |
| French | 6.2 /100 | #214 | Tragic 14.3% |