Immigrants from France vs Immigrants from Bosnia and Herzegovina Female Poverty
COMPARE
Immigrants from France
Immigrants from Bosnia and Herzegovina
Female Poverty
Female Poverty Comparison
Immigrants from France
Immigrants from Bosnia and Herzegovina
12.9%
FEMALE POVERTY
83.6/ 100
METRIC RATING
138th/ 347
METRIC RANK
13.2%
FEMALE POVERTY
69.7/ 100
METRIC RATING
156th/ 347
METRIC RANK
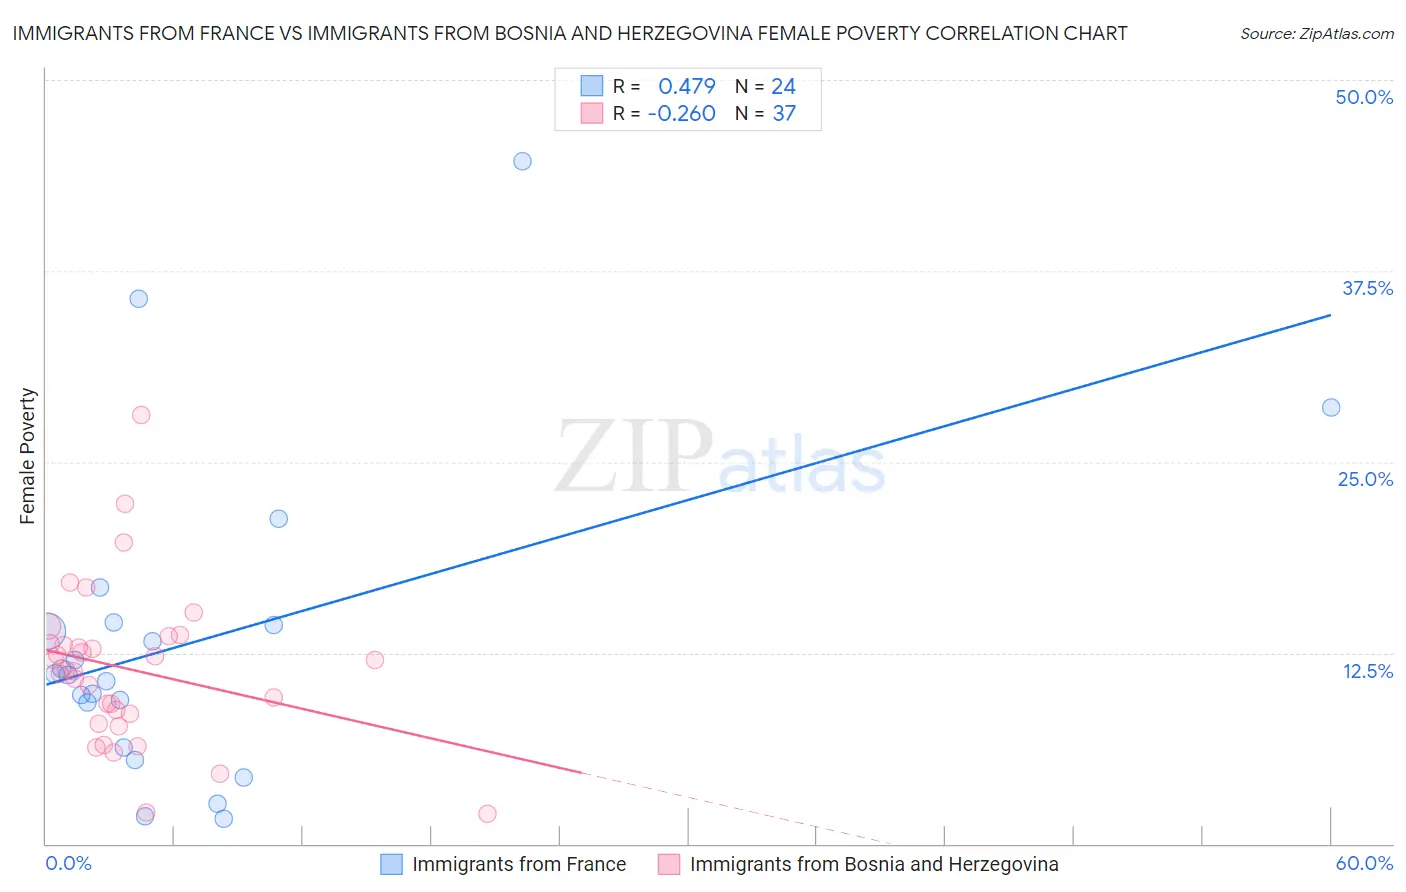
Immigrants from France vs Immigrants from Bosnia and Herzegovina Female Poverty Correlation Chart
The statistical analysis conducted on geographies consisting of 287,810,064 people shows a moderate positive correlation between the proportion of Immigrants from France and poverty level among females in the United States with a correlation coefficient (R) of 0.479 and weighted average of 12.9%. Similarly, the statistical analysis conducted on geographies consisting of 156,760,693 people shows a weak negative correlation between the proportion of Immigrants from Bosnia and Herzegovina and poverty level among females in the United States with a correlation coefficient (R) of -0.260 and weighted average of 13.2%, a difference of 2.0%.
Female Poverty Correlation Summary
| Measurement | Immigrants from France | Immigrants from Bosnia and Herzegovina |
| Minimum | 1.7% | 2.0% |
| Maximum | 44.6% | 28.1% |
| Range | 43.0% | 26.1% |
| Mean | 13.3% | 11.4% |
| Median | 11.1% | 11.4% |
| Interquartile 25% (IQ1) | 7.8% | 8.2% |
| Interquartile 75% (IQ3) | 14.4% | 13.3% |
| Interquartile Range (IQR) | 6.6% | 5.1% |
| Standard Deviation (Sample) | 10.3% | 5.2% |
| Standard Deviation (Population) | 10.1% | 5.1% |
Demographics Similar to Immigrants from France and Immigrants from Bosnia and Herzegovina by Female Poverty
In terms of female poverty, the demographic groups most similar to Immigrants from France are Basque (12.9%, a difference of 0.090%), Pakistani (12.9%, a difference of 0.10%), Chilean (12.9%, a difference of 0.22%), Icelander (13.0%, a difference of 0.43%), and Brazilian (13.0%, a difference of 0.52%). Similarly, the demographic groups most similar to Immigrants from Bosnia and Herzegovina are Hungarian (13.2%, a difference of 0.050%), Armenian (13.2%, a difference of 0.090%), Immigrants from Northern Africa (13.2%, a difference of 0.10%), Immigrants from Fiji (13.2%, a difference of 0.15%), and Samoan (13.1%, a difference of 0.47%).
| Demographics | Rating | Rank | Female Poverty |
| Chileans | 84.7 /100 | #137 | Excellent 12.9% |
| Immigrants | France | 83.6 /100 | #138 | Excellent 12.9% |
| Basques | 83.1 /100 | #139 | Excellent 12.9% |
| Pakistanis | 83.0 /100 | #140 | Excellent 12.9% |
| Icelanders | 81.1 /100 | #141 | Excellent 13.0% |
| Brazilians | 80.5 /100 | #142 | Excellent 13.0% |
| Immigrants | Malaysia | 80.4 /100 | #143 | Excellent 13.0% |
| Afghans | 79.8 /100 | #144 | Good 13.0% |
| Syrians | 79.6 /100 | #145 | Good 13.0% |
| Immigrants | Peru | 79.1 /100 | #146 | Good 13.0% |
| Immigrants | Kazakhstan | 78.6 /100 | #147 | Good 13.0% |
| Yugoslavians | 76.9 /100 | #148 | Good 13.1% |
| Taiwanese | 75.7 /100 | #149 | Good 13.1% |
| Tsimshian | 75.5 /100 | #150 | Good 13.1% |
| Immigrants | Germany | 74.9 /100 | #151 | Good 13.1% |
| Samoans | 73.6 /100 | #152 | Good 13.1% |
| Immigrants | Fiji | 71.0 /100 | #153 | Good 13.2% |
| Armenians | 70.4 /100 | #154 | Good 13.2% |
| Hungarians | 70.1 /100 | #155 | Good 13.2% |
| Immigrants | Bosnia and Herzegovina | 69.7 /100 | #156 | Good 13.2% |
| Immigrants | Northern Africa | 68.8 /100 | #157 | Good 13.2% |