Immigrants from Fiji vs Jamaican Child Poverty Under the Age of 5
COMPARE
Immigrants from Fiji
Jamaican
Child Poverty Under the Age of 5
Child Poverty Under the Age of 5 Comparison
Immigrants from Fiji
Jamaicans
15.2%
CHILD POVERTY UNDER THE AGE OF 5
99.0/ 100
METRIC RATING
65th/ 347
METRIC RANK
20.4%
CHILD POVERTY UNDER THE AGE OF 5
0.1/ 100
METRIC RATING
270th/ 347
METRIC RANK
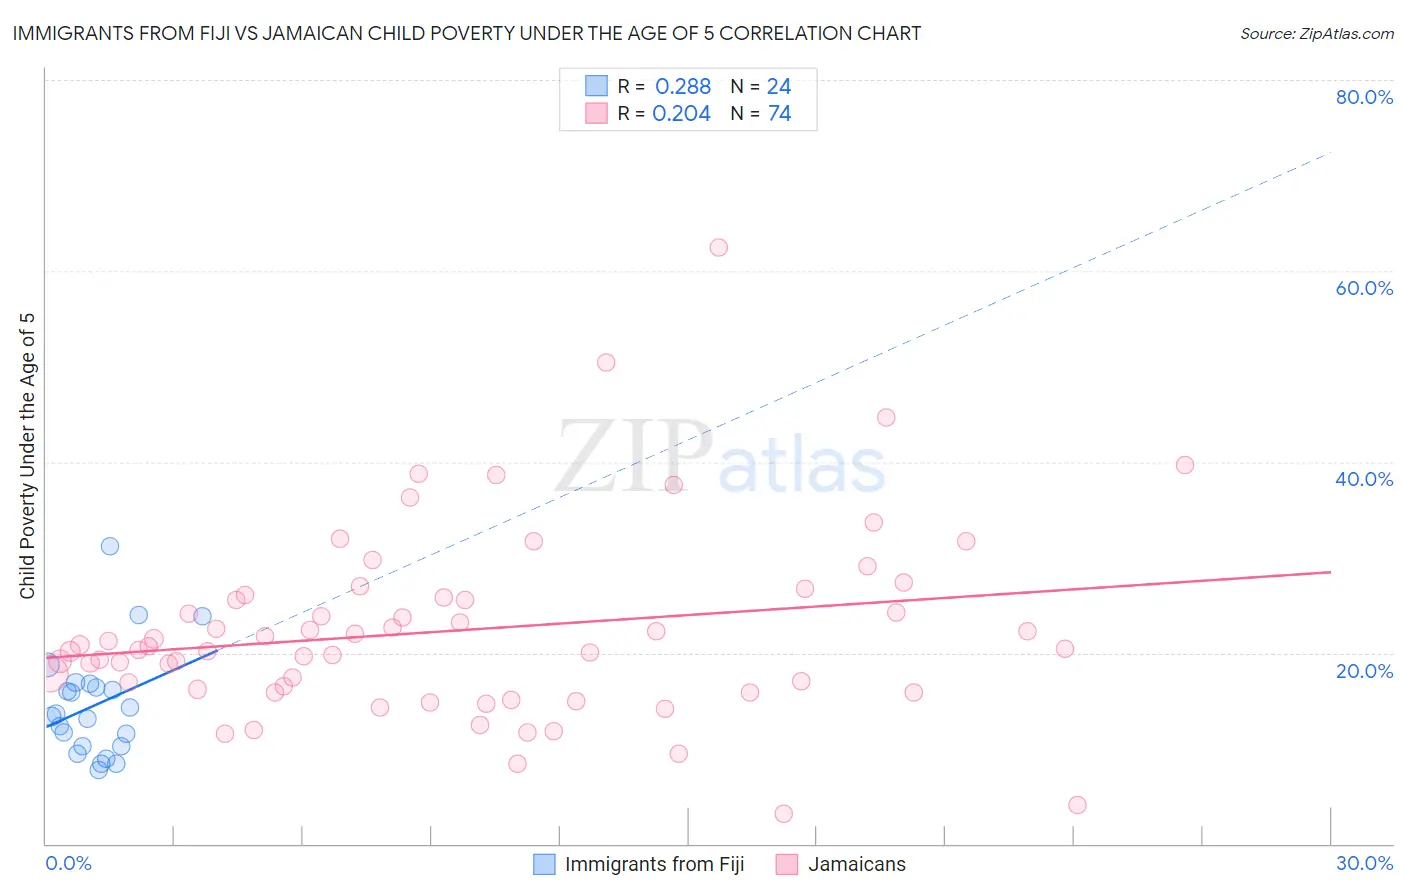
Immigrants from Fiji vs Jamaican Child Poverty Under the Age of 5 Correlation Chart
The statistical analysis conducted on geographies consisting of 92,816,757 people shows a weak positive correlation between the proportion of Immigrants from Fiji and poverty level among children under the age of 5 in the United States with a correlation coefficient (R) of 0.288 and weighted average of 15.2%. Similarly, the statistical analysis conducted on geographies consisting of 355,780,377 people shows a weak positive correlation between the proportion of Jamaicans and poverty level among children under the age of 5 in the United States with a correlation coefficient (R) of 0.204 and weighted average of 20.4%, a difference of 34.4%.
Child Poverty Under the Age of 5 Correlation Summary
| Measurement | Immigrants from Fiji | Jamaican |
| Minimum | 7.8% | 3.1% |
| Maximum | 31.2% | 62.5% |
| Range | 23.4% | 59.4% |
| Mean | 14.5% | 22.4% |
| Median | 13.4% | 20.6% |
| Interquartile 25% (IQ1) | 10.3% | 16.2% |
| Interquartile 75% (IQ3) | 16.5% | 25.8% |
| Interquartile Range (IQR) | 6.3% | 9.6% |
| Standard Deviation (Sample) | 5.6% | 9.9% |
| Standard Deviation (Population) | 5.5% | 9.8% |
Similar Demographics by Child Poverty Under the Age of 5
Demographics Similar to Immigrants from Fiji by Child Poverty Under the Age of 5
In terms of child poverty under the age of 5, the demographic groups most similar to Immigrants from Fiji are Immigrants from Romania (15.2%, a difference of 0.030%), Immigrants from Europe (15.1%, a difference of 0.050%), Immigrants from Scotland (15.2%, a difference of 0.11%), Immigrants from Eastern Europe (15.1%, a difference of 0.18%), and Greek (15.2%, a difference of 0.18%).
| Demographics | Rating | Rank | Child Poverty Under the Age of 5 |
| Swedes | 99.4 /100 | #58 | Exceptional 15.0% |
| Paraguayans | 99.4 /100 | #59 | Exceptional 15.0% |
| Immigrants | Russia | 99.3 /100 | #60 | Exceptional 15.0% |
| Immigrants | Poland | 99.1 /100 | #61 | Exceptional 15.1% |
| Immigrants | Eastern Europe | 99.1 /100 | #62 | Exceptional 15.1% |
| Immigrants | Europe | 99.1 /100 | #63 | Exceptional 15.1% |
| Immigrants | Romania | 99.1 /100 | #64 | Exceptional 15.2% |
| Immigrants | Fiji | 99.0 /100 | #65 | Exceptional 15.2% |
| Immigrants | Scotland | 99.0 /100 | #66 | Exceptional 15.2% |
| Greeks | 99.0 /100 | #67 | Exceptional 15.2% |
| Zimbabweans | 99.0 /100 | #68 | Exceptional 15.2% |
| Lithuanians | 99.0 /100 | #69 | Exceptional 15.2% |
| Immigrants | Belgium | 98.8 /100 | #70 | Exceptional 15.3% |
| Immigrants | Egypt | 98.8 /100 | #71 | Exceptional 15.3% |
| Immigrants | Sweden | 98.8 /100 | #72 | Exceptional 15.3% |
Demographics Similar to Jamaicans by Child Poverty Under the Age of 5
In terms of child poverty under the age of 5, the demographic groups most similar to Jamaicans are Immigrants from Burma/Myanmar (20.4%, a difference of 0.070%), Ottawa (20.3%, a difference of 0.16%), Belizean (20.3%, a difference of 0.16%), American (20.5%, a difference of 0.45%), and Aleut (20.3%, a difference of 0.56%).
| Demographics | Rating | Rank | Child Poverty Under the Age of 5 |
| Barbadians | 0.1 /100 | #263 | Tragic 20.2% |
| Immigrants | Liberia | 0.1 /100 | #264 | Tragic 20.2% |
| Spanish American Indians | 0.1 /100 | #265 | Tragic 20.2% |
| Aleuts | 0.1 /100 | #266 | Tragic 20.3% |
| Ottawa | 0.1 /100 | #267 | Tragic 20.3% |
| Belizeans | 0.1 /100 | #268 | Tragic 20.3% |
| Immigrants | Burma/Myanmar | 0.1 /100 | #269 | Tragic 20.4% |
| Jamaicans | 0.1 /100 | #270 | Tragic 20.4% |
| Americans | 0.1 /100 | #271 | Tragic 20.5% |
| Immigrants | Jamaica | 0.1 /100 | #272 | Tragic 20.5% |
| Central Americans | 0.1 /100 | #273 | Tragic 20.6% |
| Immigrants | Belize | 0.1 /100 | #274 | Tragic 20.6% |
| Bangladeshis | 0.1 /100 | #275 | Tragic 20.6% |
| West Indians | 0.0 /100 | #276 | Tragic 20.6% |
| Immigrants | West Indies | 0.0 /100 | #277 | Tragic 20.7% |