Immigrants from Europe vs Immigrants from Belarus Child Poverty Under the Age of 5
COMPARE
Immigrants from Europe
Immigrants from Belarus
Child Poverty Under the Age of 5
Child Poverty Under the Age of 5 Comparison
Immigrants from Europe
Immigrants from Belarus
15.1%
CHILD POVERTY UNDER THE AGE OF 5
99.1/ 100
METRIC RATING
63rd/ 347
METRIC RANK
14.7%
CHILD POVERTY UNDER THE AGE OF 5
99.7/ 100
METRIC RATING
41st/ 347
METRIC RANK
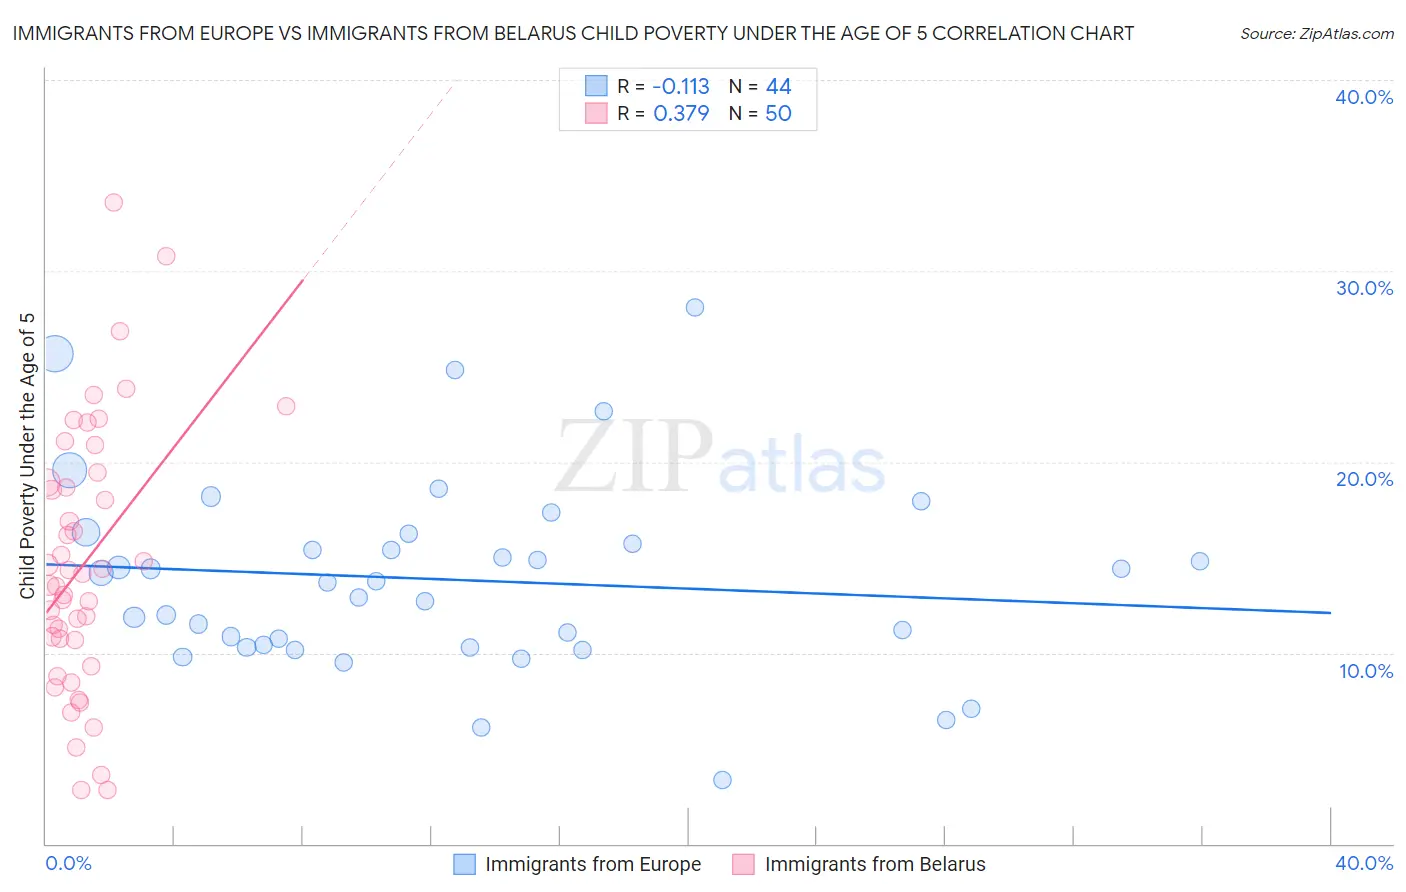
Immigrants from Europe vs Immigrants from Belarus Child Poverty Under the Age of 5 Correlation Chart
The statistical analysis conducted on geographies consisting of 511,883,823 people shows a poor negative correlation between the proportion of Immigrants from Europe and poverty level among children under the age of 5 in the United States with a correlation coefficient (R) of -0.113 and weighted average of 15.1%. Similarly, the statistical analysis conducted on geographies consisting of 145,813,526 people shows a mild positive correlation between the proportion of Immigrants from Belarus and poverty level among children under the age of 5 in the United States with a correlation coefficient (R) of 0.379 and weighted average of 14.7%, a difference of 3.3%.
Child Poverty Under the Age of 5 Correlation Summary
| Measurement | Immigrants from Europe | Immigrants from Belarus |
| Minimum | 3.3% | 2.8% |
| Maximum | 28.1% | 33.6% |
| Range | 24.7% | 30.8% |
| Mean | 13.8% | 14.7% |
| Median | 13.7% | 13.8% |
| Interquartile 25% (IQ1) | 10.4% | 10.7% |
| Interquartile 75% (IQ3) | 16.0% | 18.9% |
| Interquartile Range (IQR) | 5.6% | 8.3% |
| Standard Deviation (Sample) | 5.1% | 6.9% |
| Standard Deviation (Population) | 5.0% | 6.8% |
Similar Demographics by Child Poverty Under the Age of 5
Demographics Similar to Immigrants from Europe by Child Poverty Under the Age of 5
In terms of child poverty under the age of 5, the demographic groups most similar to Immigrants from Europe are Immigrants from Romania (15.2%, a difference of 0.020%), Immigrants from Fiji (15.2%, a difference of 0.050%), Immigrants from Eastern Europe (15.1%, a difference of 0.13%), Immigrants from Scotland (15.2%, a difference of 0.16%), and Greek (15.2%, a difference of 0.23%).
| Demographics | Rating | Rank | Child Poverty Under the Age of 5 |
| Immigrants | Pakistan | 99.4 /100 | #56 | Exceptional 14.9% |
| Egyptians | 99.4 /100 | #57 | Exceptional 14.9% |
| Swedes | 99.4 /100 | #58 | Exceptional 15.0% |
| Paraguayans | 99.4 /100 | #59 | Exceptional 15.0% |
| Immigrants | Russia | 99.3 /100 | #60 | Exceptional 15.0% |
| Immigrants | Poland | 99.1 /100 | #61 | Exceptional 15.1% |
| Immigrants | Eastern Europe | 99.1 /100 | #62 | Exceptional 15.1% |
| Immigrants | Europe | 99.1 /100 | #63 | Exceptional 15.1% |
| Immigrants | Romania | 99.1 /100 | #64 | Exceptional 15.2% |
| Immigrants | Fiji | 99.0 /100 | #65 | Exceptional 15.2% |
| Immigrants | Scotland | 99.0 /100 | #66 | Exceptional 15.2% |
| Greeks | 99.0 /100 | #67 | Exceptional 15.2% |
| Zimbabweans | 99.0 /100 | #68 | Exceptional 15.2% |
| Lithuanians | 99.0 /100 | #69 | Exceptional 15.2% |
| Immigrants | Belgium | 98.8 /100 | #70 | Exceptional 15.3% |
Demographics Similar to Immigrants from Belarus by Child Poverty Under the Age of 5
In terms of child poverty under the age of 5, the demographic groups most similar to Immigrants from Belarus are Immigrants from Australia (14.6%, a difference of 0.12%), Soviet Union (14.7%, a difference of 0.16%), Immigrants from Greece (14.7%, a difference of 0.16%), Immigrants from Philippines (14.7%, a difference of 0.29%), and Eastern European (14.6%, a difference of 0.41%).
| Demographics | Rating | Rank | Child Poverty Under the Age of 5 |
| Immigrants | Moldova | 99.8 /100 | #34 | Exceptional 14.5% |
| Latvians | 99.8 /100 | #35 | Exceptional 14.5% |
| Maltese | 99.8 /100 | #36 | Exceptional 14.5% |
| Turks | 99.7 /100 | #37 | Exceptional 14.6% |
| Eastern Europeans | 99.7 /100 | #38 | Exceptional 14.6% |
| Norwegians | 99.7 /100 | #39 | Exceptional 14.6% |
| Immigrants | Australia | 99.7 /100 | #40 | Exceptional 14.6% |
| Immigrants | Belarus | 99.7 /100 | #41 | Exceptional 14.7% |
| Soviet Union | 99.7 /100 | #42 | Exceptional 14.7% |
| Immigrants | Greece | 99.7 /100 | #43 | Exceptional 14.7% |
| Immigrants | Philippines | 99.7 /100 | #44 | Exceptional 14.7% |
| Laotians | 99.6 /100 | #45 | Exceptional 14.7% |
| Tsimshian | 99.6 /100 | #46 | Exceptional 14.7% |
| Russians | 99.6 /100 | #47 | Exceptional 14.8% |
| Immigrants | Czechoslovakia | 99.6 /100 | #48 | Exceptional 14.8% |