Soviet Union vs Immigrants from Netherlands Female Poverty Among 18-24 Year Olds
COMPARE
Soviet Union
Immigrants from Netherlands
Female Poverty Among 18-24 Year Olds
Female Poverty Among 18-24 Year Olds Comparison
Soviet Union
Immigrants from Netherlands
19.5%
FEMALE POVERTY AMONG 18-24 YEAR OLDS
92.0/ 100
METRIC RATING
135th/ 347
METRIC RANK
20.5%
FEMALE POVERTY AMONG 18-24 YEAR OLDS
17.0/ 100
METRIC RATING
204th/ 347
METRIC RANK
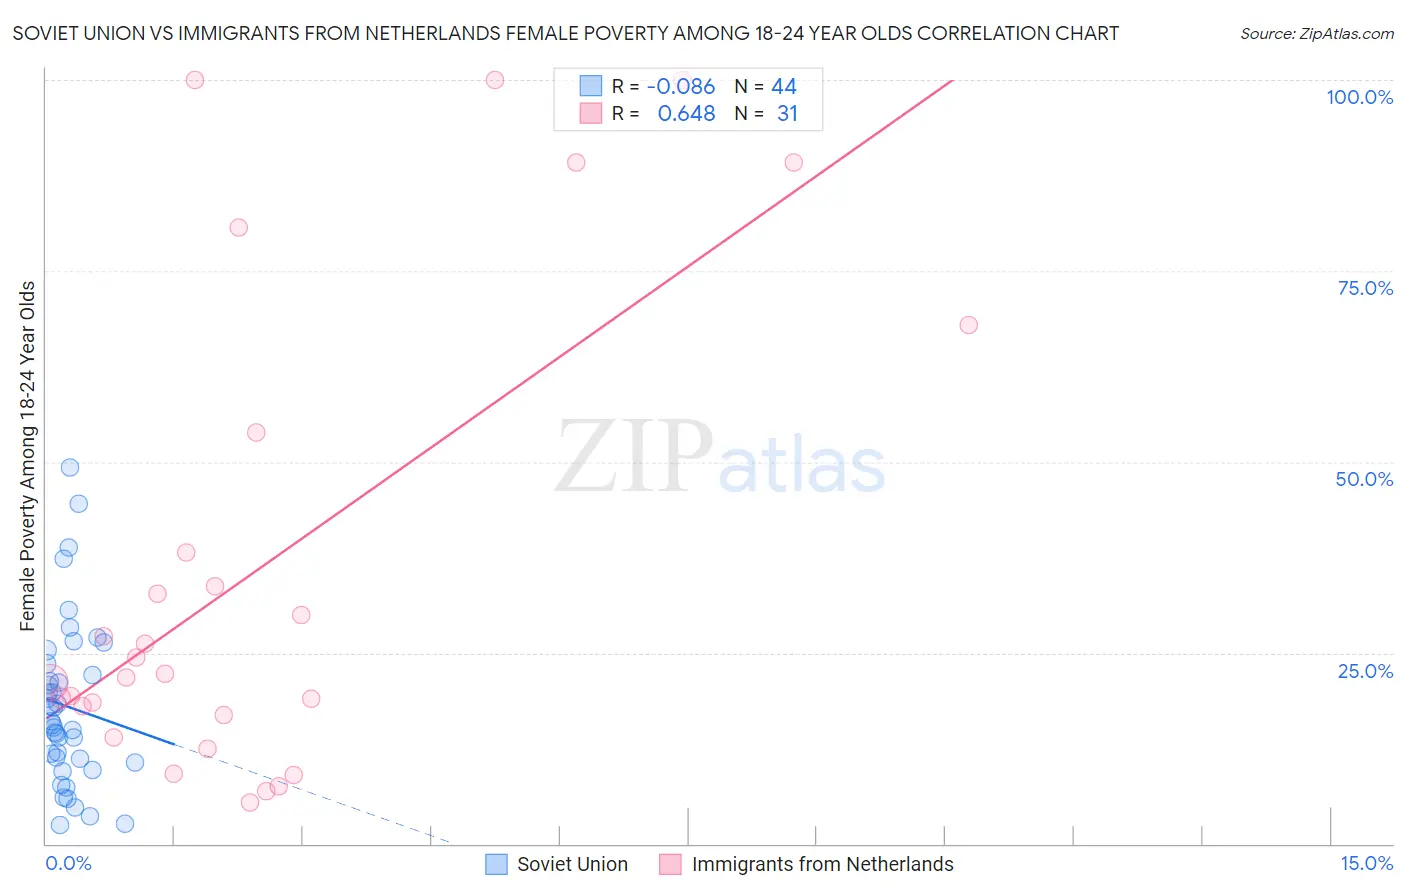
Soviet Union vs Immigrants from Netherlands Female Poverty Among 18-24 Year Olds Correlation Chart
The statistical analysis conducted on geographies consisting of 43,300,584 people shows a slight negative correlation between the proportion of Soviet Union and poverty level among females between the ages 18 and 24 in the United States with a correlation coefficient (R) of -0.086 and weighted average of 19.5%. Similarly, the statistical analysis conducted on geographies consisting of 233,588,287 people shows a significant positive correlation between the proportion of Immigrants from Netherlands and poverty level among females between the ages 18 and 24 in the United States with a correlation coefficient (R) of 0.648 and weighted average of 20.5%, a difference of 5.1%.
Female Poverty Among 18-24 Year Olds Correlation Summary
| Measurement | Soviet Union | Immigrants from Netherlands |
| Minimum | 2.4% | 5.4% |
| Maximum | 49.3% | 100.0% |
| Range | 46.8% | 94.6% |
| Mean | 18.0% | 36.6% |
| Median | 15.9% | 22.3% |
| Interquartile 25% (IQ1) | 10.9% | 16.9% |
| Interquartile 75% (IQ3) | 22.8% | 53.8% |
| Interquartile Range (IQR) | 11.9% | 37.0% |
| Standard Deviation (Sample) | 10.7% | 31.2% |
| Standard Deviation (Population) | 10.6% | 30.7% |
Similar Demographics by Female Poverty Among 18-24 Year Olds
Demographics Similar to Soviet Union by Female Poverty Among 18-24 Year Olds
In terms of female poverty among 18-24 year olds, the demographic groups most similar to Soviet Union are Immigrants from North America (19.5%, a difference of 0.010%), Jamaican (19.5%, a difference of 0.020%), Turkish (19.5%, a difference of 0.020%), Russian (19.5%, a difference of 0.090%), and Latvian (19.5%, a difference of 0.12%).
| Demographics | Rating | Rank | Female Poverty Among 18-24 Year Olds |
| Slovaks | 92.9 /100 | #128 | Exceptional 19.5% |
| Immigrants | England | 92.9 /100 | #129 | Exceptional 19.5% |
| Immigrants | Canada | 92.9 /100 | #130 | Exceptional 19.5% |
| Latvians | 92.7 /100 | #131 | Exceptional 19.5% |
| Jamaicans | 92.1 /100 | #132 | Exceptional 19.5% |
| Turks | 92.1 /100 | #133 | Exceptional 19.5% |
| Immigrants | North America | 92.1 /100 | #134 | Exceptional 19.5% |
| Soviet Union | 92.0 /100 | #135 | Exceptional 19.5% |
| Russians | 91.5 /100 | #136 | Exceptional 19.5% |
| Austrians | 90.7 /100 | #137 | Exceptional 19.5% |
| Immigrants | Morocco | 89.9 /100 | #138 | Excellent 19.6% |
| Indians (Asian) | 88.3 /100 | #139 | Excellent 19.6% |
| Immigrants | Trinidad and Tobago | 85.6 /100 | #140 | Excellent 19.7% |
| Pennsylvania Germans | 85.5 /100 | #141 | Excellent 19.7% |
| Panamanians | 84.6 /100 | #142 | Excellent 19.7% |
Demographics Similar to Immigrants from Netherlands by Female Poverty Among 18-24 Year Olds
In terms of female poverty among 18-24 year olds, the demographic groups most similar to Immigrants from Netherlands are Immigrants from Malaysia (20.5%, a difference of 0.020%), English (20.5%, a difference of 0.020%), Hispanic or Latino (20.5%, a difference of 0.030%), Spaniard (20.5%, a difference of 0.050%), and Immigrants from Turkey (20.5%, a difference of 0.060%).
| Demographics | Rating | Rank | Female Poverty Among 18-24 Year Olds |
| Zimbabweans | 21.0 /100 | #197 | Fair 20.4% |
| Immigrants | Spain | 20.7 /100 | #198 | Fair 20.4% |
| Germans | 20.6 /100 | #199 | Fair 20.4% |
| Europeans | 19.9 /100 | #200 | Poor 20.4% |
| Mexicans | 18.3 /100 | #201 | Poor 20.5% |
| Immigrants | Turkey | 17.7 /100 | #202 | Poor 20.5% |
| Immigrants | Malaysia | 17.2 /100 | #203 | Poor 20.5% |
| Immigrants | Netherlands | 17.0 /100 | #204 | Poor 20.5% |
| English | 16.7 /100 | #205 | Poor 20.5% |
| Hispanics or Latinos | 16.6 /100 | #206 | Poor 20.5% |
| Spaniards | 16.3 /100 | #207 | Poor 20.5% |
| Dutch | 15.9 /100 | #208 | Poor 20.5% |
| Arabs | 15.5 /100 | #209 | Poor 20.5% |
| Immigrants | Ghana | 14.3 /100 | #210 | Poor 20.5% |
| Immigrants | Western Europe | 13.5 /100 | #211 | Poor 20.6% |