Immigrants from England vs Immigrants from Dominican Republic Seniors Poverty Over the Age of 65
COMPARE
Immigrants from England
Immigrants from Dominican Republic
Seniors Poverty Over the Age of 65
Seniors Poverty Over the Age of 65 Comparison
Immigrants from England
Immigrants from Dominican Republic
9.8%
SENIORS POVERTY OVER THE AGE OF 65
99.1/ 100
METRIC RATING
56th/ 347
METRIC RANK
18.3%
SENIORS POVERTY OVER THE AGE OF 65
0.0/ 100
METRIC RATING
344th/ 347
METRIC RANK
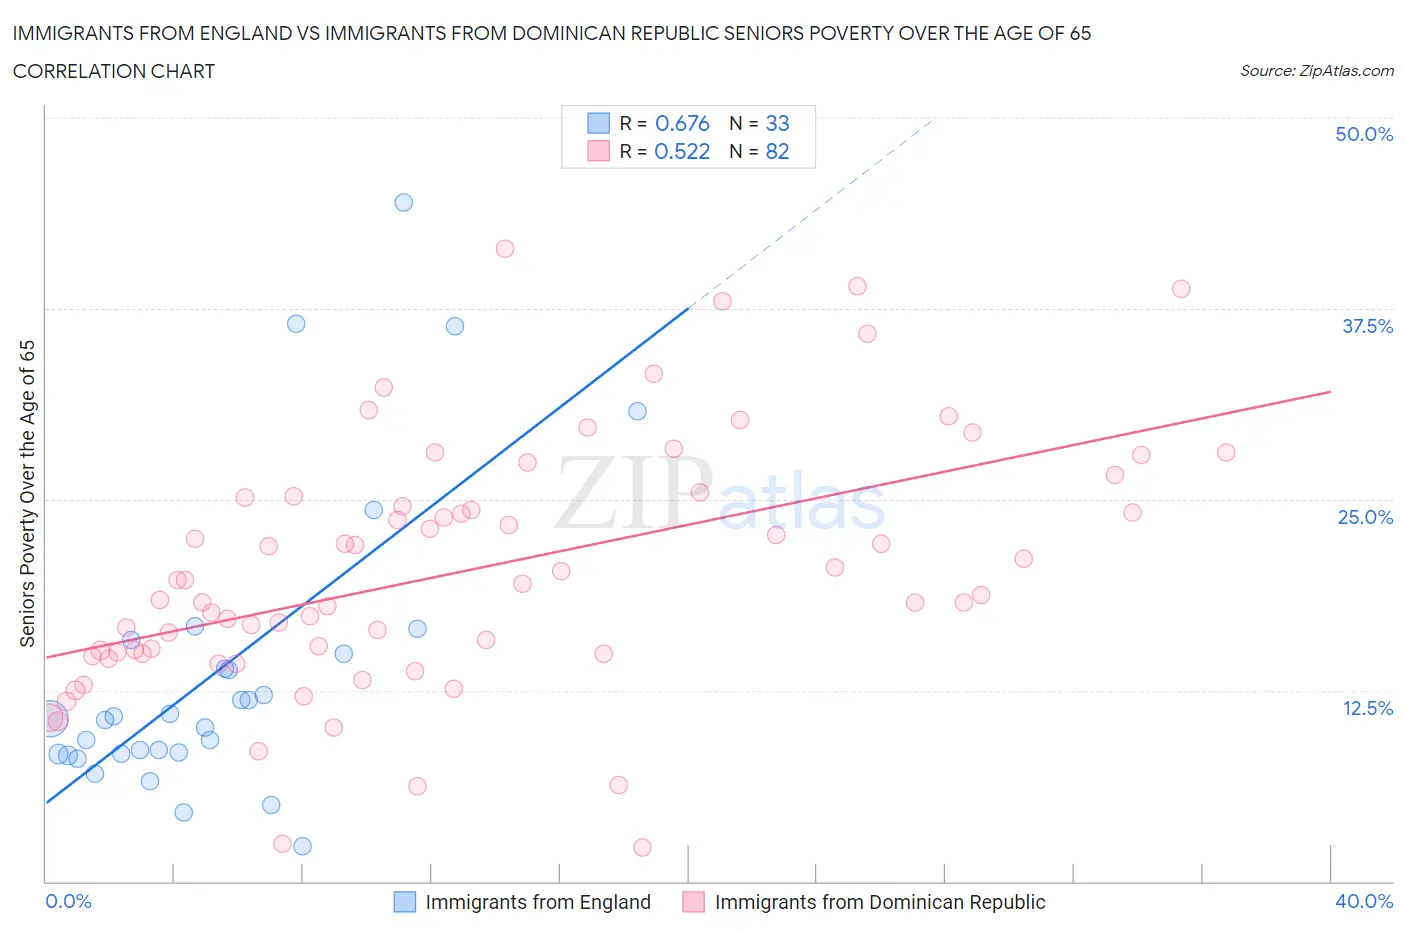
Immigrants from England vs Immigrants from Dominican Republic Seniors Poverty Over the Age of 65 Correlation Chart
The statistical analysis conducted on geographies consisting of 390,707,627 people shows a significant positive correlation between the proportion of Immigrants from England and poverty level among seniors over the age of 65 in the United States with a correlation coefficient (R) of 0.676 and weighted average of 9.8%. Similarly, the statistical analysis conducted on geographies consisting of 274,160,985 people shows a substantial positive correlation between the proportion of Immigrants from Dominican Republic and poverty level among seniors over the age of 65 in the United States with a correlation coefficient (R) of 0.522 and weighted average of 18.3%, a difference of 86.9%.
Seniors Poverty Over the Age of 65 Correlation Summary
| Measurement | Immigrants from England | Immigrants from Dominican Republic |
| Minimum | 2.3% | 2.2% |
| Maximum | 44.4% | 41.4% |
| Range | 42.1% | 39.2% |
| Mean | 13.8% | 20.3% |
| Median | 10.7% | 19.1% |
| Interquartile 25% (IQ1) | 8.3% | 14.9% |
| Interquartile 75% (IQ3) | 15.3% | 25.1% |
| Interquartile Range (IQR) | 7.0% | 10.2% |
| Standard Deviation (Sample) | 9.8% | 8.1% |
| Standard Deviation (Population) | 9.7% | 8.1% |
Similar Demographics by Seniors Poverty Over the Age of 65
Demographics Similar to Immigrants from England by Seniors Poverty Over the Age of 65
In terms of seniors poverty over the age of 65, the demographic groups most similar to Immigrants from England are Afghan (9.8%, a difference of 0.12%), Bolivian (9.8%, a difference of 0.12%), Serbian (9.8%, a difference of 0.19%), Immigrants from Northern Europe (9.8%, a difference of 0.25%), and Slavic (9.8%, a difference of 0.31%).
| Demographics | Rating | Rank | Seniors Poverty Over the Age of 65 |
| Immigrants | Lithuania | 99.4 /100 | #49 | Exceptional 9.7% |
| Hungarians | 99.4 /100 | #50 | Exceptional 9.7% |
| Carpatho Rusyns | 99.3 /100 | #51 | Exceptional 9.7% |
| Filipinos | 99.3 /100 | #52 | Exceptional 9.7% |
| Slavs | 99.2 /100 | #53 | Exceptional 9.8% |
| Immigrants | Northern Europe | 99.2 /100 | #54 | Exceptional 9.8% |
| Afghans | 99.2 /100 | #55 | Exceptional 9.8% |
| Immigrants | England | 99.1 /100 | #56 | Exceptional 9.8% |
| Bolivians | 99.1 /100 | #57 | Exceptional 9.8% |
| Serbians | 99.1 /100 | #58 | Exceptional 9.8% |
| Immigrants | Canada | 99.0 /100 | #59 | Exceptional 9.8% |
| Celtics | 99.0 /100 | #60 | Exceptional 9.8% |
| Iranians | 98.9 /100 | #61 | Exceptional 9.8% |
| French Canadians | 98.9 /100 | #62 | Exceptional 9.8% |
| Macedonians | 98.8 /100 | #63 | Exceptional 9.9% |
Demographics Similar to Immigrants from Dominican Republic by Seniors Poverty Over the Age of 65
In terms of seniors poverty over the age of 65, the demographic groups most similar to Immigrants from Dominican Republic are Lumbee (18.1%, a difference of 0.90%), Immigrants from Cuba (17.9%, a difference of 2.0%), Dominican (17.8%, a difference of 2.5%), Hopi (17.8%, a difference of 2.9%), and Navajo (17.5%, a difference of 4.8%).
| Demographics | Rating | Rank | Seniors Poverty Over the Age of 65 |
| Immigrants | Yemen | 0.0 /100 | #333 | Tragic 15.9% |
| Immigrants | Nicaragua | 0.0 /100 | #334 | Tragic 15.9% |
| Cubans | 0.0 /100 | #335 | Tragic 16.1% |
| Immigrants | Cabo Verde | 0.0 /100 | #336 | Tragic 16.2% |
| Immigrants | Caribbean | 0.0 /100 | #337 | Tragic 16.5% |
| Pueblo | 0.0 /100 | #338 | Tragic 17.2% |
| Navajo | 0.0 /100 | #339 | Tragic 17.5% |
| Hopi | 0.0 /100 | #340 | Tragic 17.8% |
| Dominicans | 0.0 /100 | #341 | Tragic 17.8% |
| Immigrants | Cuba | 0.0 /100 | #342 | Tragic 17.9% |
| Lumbee | 0.0 /100 | #343 | Tragic 18.1% |
| Immigrants | Dominican Republic | 0.0 /100 | #344 | Tragic 18.3% |
| Pima | 0.0 /100 | #345 | Tragic 19.8% |
| Tohono O'odham | 0.0 /100 | #346 | Tragic 20.8% |
| Puerto Ricans | 0.0 /100 | #347 | Tragic 21.4% |