Immigrants from El Salvador vs Immigrants from Middle Africa Child Poverty Among Girls Under 16
COMPARE
Immigrants from El Salvador
Immigrants from Middle Africa
Child Poverty Among Girls Under 16
Child Poverty Among Girls Under 16 Comparison
Immigrants from El Salvador
Immigrants from Middle Africa
20.0%
CHILD POVERTY AMONG GIRLS UNDER 16
0.1/ 100
METRIC RATING
272nd/ 347
METRIC RANK
19.2%
CHILD POVERTY AMONG GIRLS UNDER 16
0.3/ 100
METRIC RATING
252nd/ 347
METRIC RANK
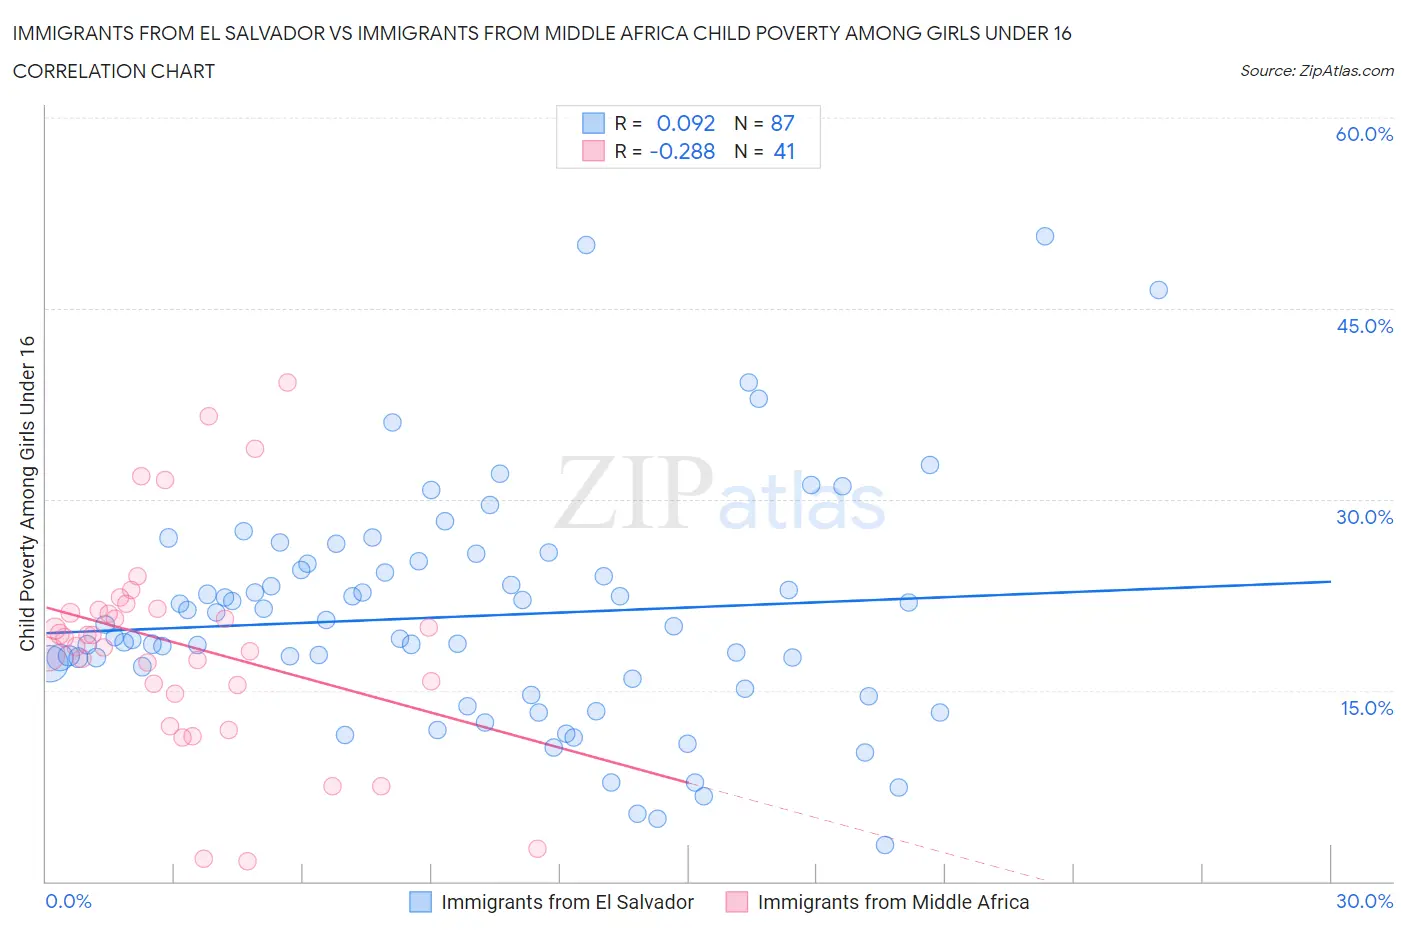
Immigrants from El Salvador vs Immigrants from Middle Africa Child Poverty Among Girls Under 16 Correlation Chart
The statistical analysis conducted on geographies consisting of 353,816,537 people shows a slight positive correlation between the proportion of Immigrants from El Salvador and poverty level among girls under the age of 16 in the United States with a correlation coefficient (R) of 0.092 and weighted average of 20.0%. Similarly, the statistical analysis conducted on geographies consisting of 201,454,449 people shows a weak negative correlation between the proportion of Immigrants from Middle Africa and poverty level among girls under the age of 16 in the United States with a correlation coefficient (R) of -0.288 and weighted average of 19.2%, a difference of 3.7%.
Child Poverty Among Girls Under 16 Correlation Summary
| Measurement | Immigrants from El Salvador | Immigrants from Middle Africa |
| Minimum | 2.8% | 1.6% |
| Maximum | 50.7% | 39.2% |
| Range | 47.8% | 37.6% |
| Mean | 20.8% | 18.6% |
| Median | 20.0% | 19.1% |
| Interquartile 25% (IQ1) | 15.2% | 15.0% |
| Interquartile 75% (IQ3) | 24.9% | 21.4% |
| Interquartile Range (IQR) | 9.8% | 6.4% |
| Standard Deviation (Sample) | 9.1% | 8.3% |
| Standard Deviation (Population) | 9.0% | 8.2% |
Demographics Similar to Immigrants from El Salvador and Immigrants from Middle Africa by Child Poverty Among Girls Under 16
In terms of child poverty among girls under 16, the demographic groups most similar to Immigrants from El Salvador are Immigrants from Barbados (19.9%, a difference of 0.11%), Cherokee (19.9%, a difference of 0.21%), Liberian (19.9%, a difference of 0.40%), Spanish American Indian (19.9%, a difference of 0.50%), and Immigrants from Bangladesh (19.9%, a difference of 0.54%). Similarly, the demographic groups most similar to Immigrants from Middle Africa are Immigrants from Guyana (19.3%, a difference of 0.20%), Immigrants from Western Africa (19.3%, a difference of 0.26%), Immigrants from Ecuador (19.3%, a difference of 0.28%), Trinidadian and Tobagonian (19.3%, a difference of 0.34%), and Guyanese (19.4%, a difference of 0.59%).
| Demographics | Rating | Rank | Child Poverty Among Girls Under 16 |
| Immigrants | Middle Africa | 0.3 /100 | #252 | Tragic 19.2% |
| Immigrants | Guyana | 0.3 /100 | #253 | Tragic 19.3% |
| Immigrants | Western Africa | 0.3 /100 | #254 | Tragic 19.3% |
| Immigrants | Ecuador | 0.3 /100 | #255 | Tragic 19.3% |
| Trinidadians and Tobagonians | 0.2 /100 | #256 | Tragic 19.3% |
| Guyanese | 0.2 /100 | #257 | Tragic 19.4% |
| Salvadorans | 0.2 /100 | #258 | Tragic 19.4% |
| Ottawa | 0.2 /100 | #259 | Tragic 19.4% |
| Mexican American Indians | 0.2 /100 | #260 | Tragic 19.5% |
| Vietnamese | 0.2 /100 | #261 | Tragic 19.5% |
| Chickasaw | 0.1 /100 | #262 | Tragic 19.6% |
| Immigrants | Burma/Myanmar | 0.1 /100 | #263 | Tragic 19.7% |
| Jamaicans | 0.1 /100 | #264 | Tragic 19.7% |
| Immigrants | Jamaica | 0.1 /100 | #265 | Tragic 19.8% |
| Spanish Americans | 0.1 /100 | #266 | Tragic 19.8% |
| Immigrants | Bangladesh | 0.1 /100 | #267 | Tragic 19.9% |
| Spanish American Indians | 0.1 /100 | #268 | Tragic 19.9% |
| Liberians | 0.1 /100 | #269 | Tragic 19.9% |
| Cherokee | 0.1 /100 | #270 | Tragic 19.9% |
| Immigrants | Barbados | 0.1 /100 | #271 | Tragic 19.9% |
| Immigrants | El Salvador | 0.1 /100 | #272 | Tragic 20.0% |