Immigrants from Egypt vs Brazilian Seniors Poverty Over the Age of 65
COMPARE
Immigrants from Egypt
Brazilian
Seniors Poverty Over the Age of 65
Seniors Poverty Over the Age of 65 Comparison
Immigrants from Egypt
Brazilians
10.6%
SENIORS POVERTY OVER THE AGE OF 65
76.5/ 100
METRIC RATING
152nd/ 347
METRIC RANK
11.3%
SENIORS POVERTY OVER THE AGE OF 65
15.4/ 100
METRIC RATING
205th/ 347
METRIC RANK
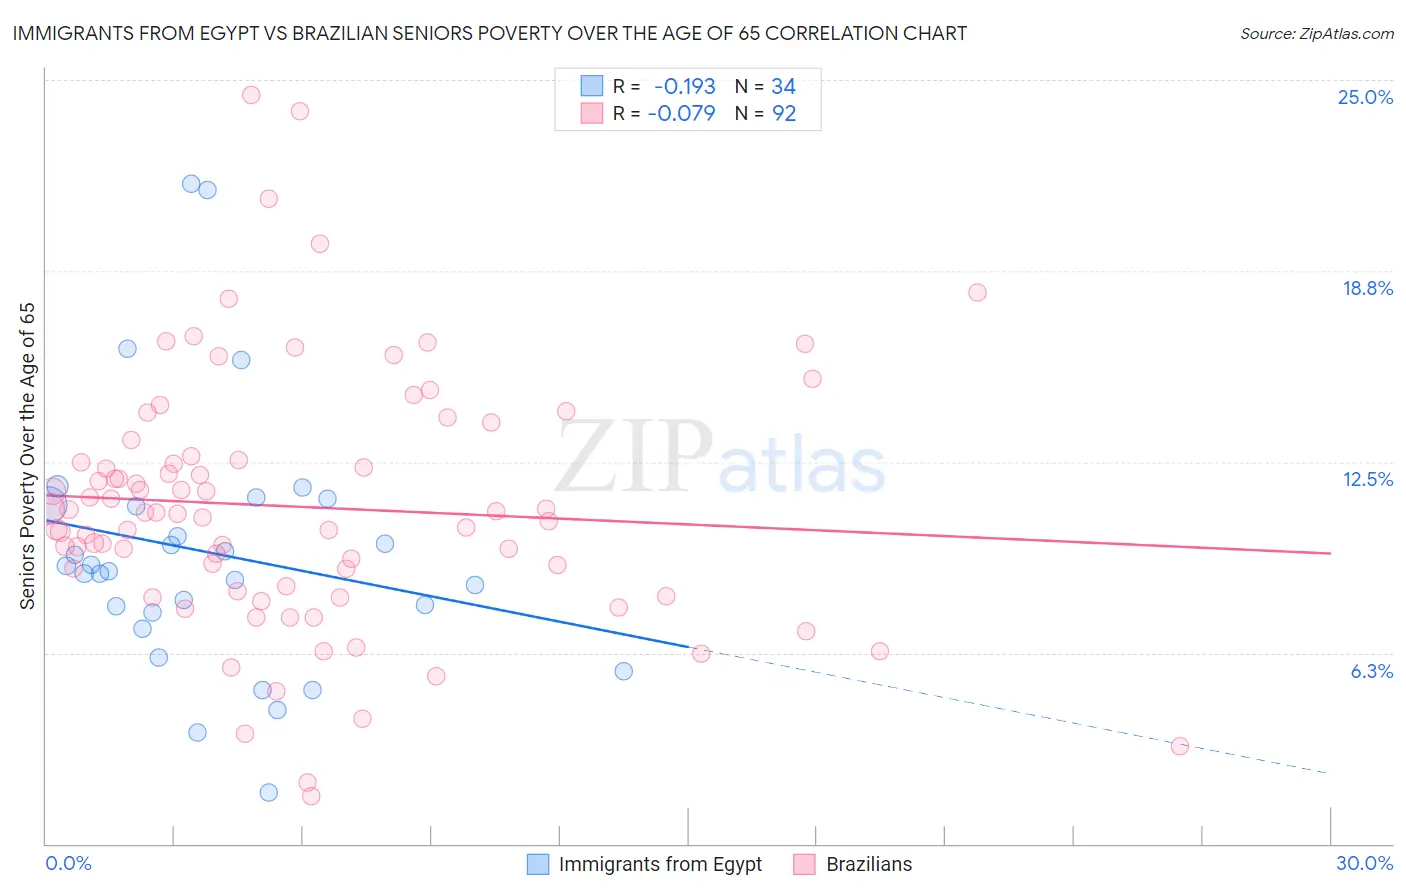
Immigrants from Egypt vs Brazilian Seniors Poverty Over the Age of 65 Correlation Chart
The statistical analysis conducted on geographies consisting of 245,049,036 people shows a poor negative correlation between the proportion of Immigrants from Egypt and poverty level among seniors over the age of 65 in the United States with a correlation coefficient (R) of -0.193 and weighted average of 10.6%. Similarly, the statistical analysis conducted on geographies consisting of 322,811,163 people shows a slight negative correlation between the proportion of Brazilians and poverty level among seniors over the age of 65 in the United States with a correlation coefficient (R) of -0.079 and weighted average of 11.3%, a difference of 6.6%.
Seniors Poverty Over the Age of 65 Correlation Summary
| Measurement | Immigrants from Egypt | Brazilian |
| Minimum | 1.7% | 1.6% |
| Maximum | 21.6% | 24.5% |
| Range | 19.9% | 22.9% |
| Mean | 9.5% | 11.0% |
| Median | 9.0% | 10.8% |
| Interquartile 25% (IQ1) | 7.6% | 8.3% |
| Interquartile 75% (IQ3) | 11.1% | 12.6% |
| Interquartile Range (IQR) | 3.5% | 4.3% |
| Standard Deviation (Sample) | 4.3% | 4.2% |
| Standard Deviation (Population) | 4.2% | 4.2% |
Similar Demographics by Seniors Poverty Over the Age of 65
Demographics Similar to Immigrants from Egypt by Seniors Poverty Over the Age of 65
In terms of seniors poverty over the age of 65, the demographic groups most similar to Immigrants from Egypt are Spanish (10.6%, a difference of 0.040%), Immigrants from Switzerland (10.6%, a difference of 0.10%), Fijian (10.7%, a difference of 0.11%), Immigrants from Saudi Arabia (10.7%, a difference of 0.19%), and American (10.6%, a difference of 0.21%).
| Demographics | Rating | Rank | Seniors Poverty Over the Age of 65 |
| Laotians | 79.9 /100 | #145 | Good 10.6% |
| Alaskan Athabascans | 79.1 /100 | #146 | Good 10.6% |
| Immigrants | Greece | 79.0 /100 | #147 | Good 10.6% |
| Americans | 78.1 /100 | #148 | Good 10.6% |
| Immigrants | Cameroon | 78.1 /100 | #149 | Good 10.6% |
| Immigrants | Switzerland | 77.3 /100 | #150 | Good 10.6% |
| Spanish | 76.8 /100 | #151 | Good 10.6% |
| Immigrants | Egypt | 76.5 /100 | #152 | Good 10.6% |
| Fijians | 75.6 /100 | #153 | Good 10.7% |
| Immigrants | Saudi Arabia | 74.9 /100 | #154 | Good 10.7% |
| Chickasaw | 73.6 /100 | #155 | Good 10.7% |
| Ethiopians | 72.9 /100 | #156 | Good 10.7% |
| Immigrants | Ethiopia | 72.9 /100 | #157 | Good 10.7% |
| Immigrants | Sierra Leone | 71.7 /100 | #158 | Good 10.7% |
| Immigrants | Micronesia | 70.8 /100 | #159 | Good 10.7% |
Demographics Similar to Brazilians by Seniors Poverty Over the Age of 65
In terms of seniors poverty over the age of 65, the demographic groups most similar to Brazilians are Choctaw (11.4%, a difference of 0.14%), Israeli (11.3%, a difference of 0.18%), Immigrants from Zaire (11.3%, a difference of 0.24%), Costa Rican (11.3%, a difference of 0.25%), and Immigrants from Western Asia (11.4%, a difference of 0.31%).
| Demographics | Rating | Rank | Seniors Poverty Over the Age of 65 |
| Immigrants | Burma/Myanmar | 21.3 /100 | #198 | Fair 11.3% |
| Immigrants | Israel | 20.3 /100 | #199 | Fair 11.3% |
| Alsatians | 20.1 /100 | #200 | Fair 11.3% |
| Immigrants | Brazil | 17.8 /100 | #201 | Poor 11.3% |
| Costa Ricans | 17.0 /100 | #202 | Poor 11.3% |
| Immigrants | Zaire | 16.9 /100 | #203 | Poor 11.3% |
| Israelis | 16.5 /100 | #204 | Poor 11.3% |
| Brazilians | 15.4 /100 | #205 | Poor 11.3% |
| Choctaw | 14.5 /100 | #206 | Poor 11.4% |
| Immigrants | Western Asia | 13.6 /100 | #207 | Poor 11.4% |
| South American Indians | 11.7 /100 | #208 | Poor 11.4% |
| Paraguayans | 11.3 /100 | #209 | Poor 11.4% |
| Ugandans | 11.2 /100 | #210 | Poor 11.4% |
| Indonesians | 10.4 /100 | #211 | Poor 11.5% |
| Immigrants | China | 9.5 /100 | #212 | Tragic 11.5% |