Immigrants from Eastern Africa vs Pueblo Single Father Poverty
COMPARE
Immigrants from Eastern Africa
Pueblo
Single Father Poverty
Single Father Poverty Comparison
Immigrants from Eastern Africa
Pueblo
14.7%
SINGLE FATHER POVERTY
100.0/ 100
METRIC RATING
37th/ 347
METRIC RANK
21.1%
SINGLE FATHER POVERTY
0.0/ 100
METRIC RATING
328th/ 347
METRIC RANK
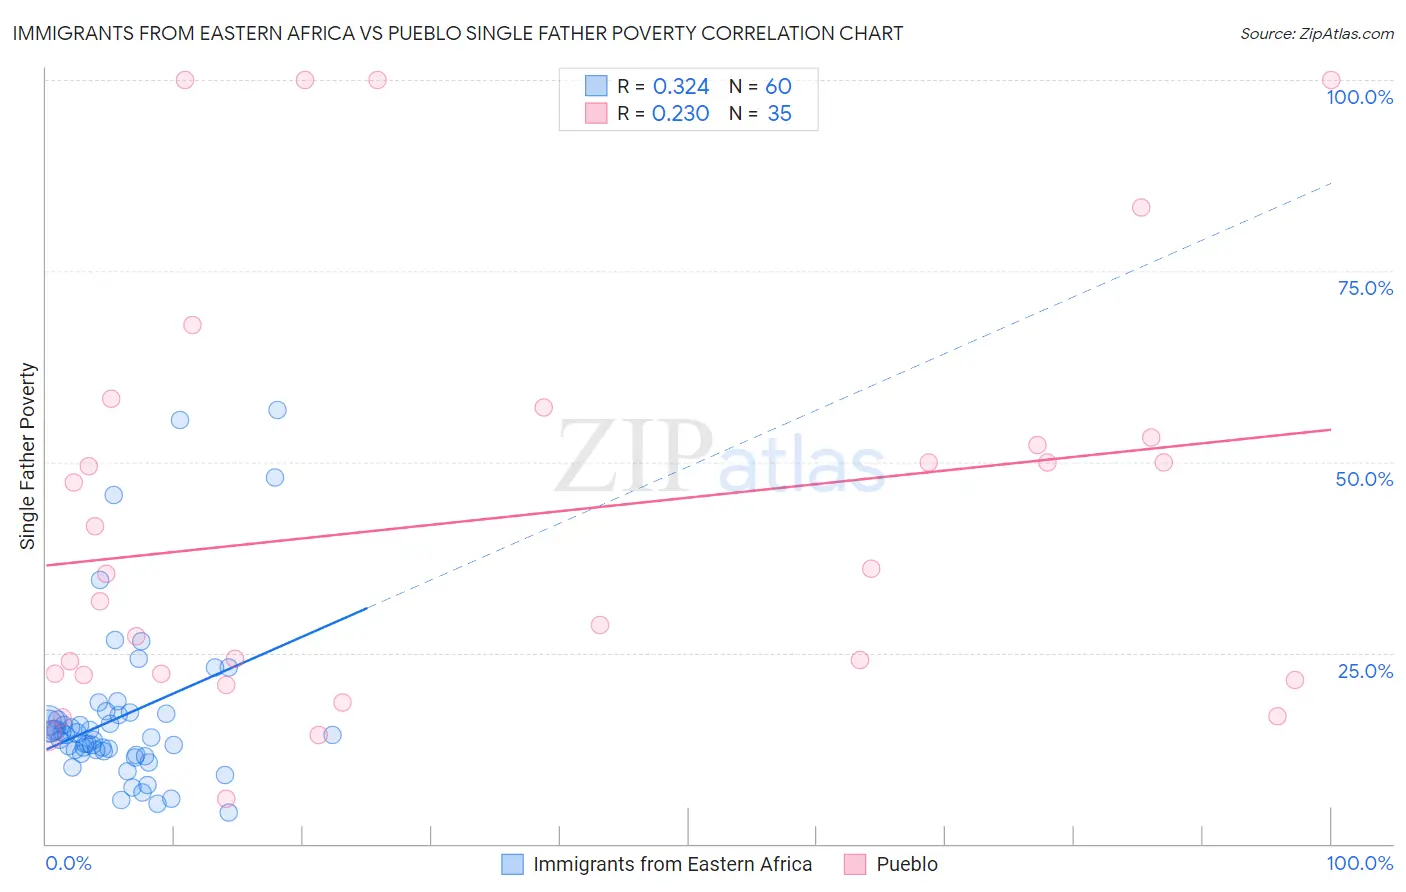
Immigrants from Eastern Africa vs Pueblo Single Father Poverty Correlation Chart
The statistical analysis conducted on geographies consisting of 287,393,274 people shows a mild positive correlation between the proportion of Immigrants from Eastern Africa and poverty level among single fathers in the United States with a correlation coefficient (R) of 0.324 and weighted average of 14.7%. Similarly, the statistical analysis conducted on geographies consisting of 109,475,284 people shows a weak positive correlation between the proportion of Pueblo and poverty level among single fathers in the United States with a correlation coefficient (R) of 0.230 and weighted average of 21.1%, a difference of 43.6%.
Single Father Poverty Correlation Summary
| Measurement | Immigrants from Eastern Africa | Pueblo |
| Minimum | 4.1% | 5.9% |
| Maximum | 56.8% | 100.0% |
| Range | 52.7% | 94.1% |
| Mean | 16.7% | 42.5% |
| Median | 14.3% | 35.3% |
| Interquartile 25% (IQ1) | 11.9% | 22.1% |
| Interquartile 75% (IQ3) | 16.9% | 53.2% |
| Interquartile Range (IQR) | 5.0% | 31.2% |
| Standard Deviation (Sample) | 10.8% | 27.2% |
| Standard Deviation (Population) | 10.8% | 26.8% |
Similar Demographics by Single Father Poverty
Demographics Similar to Immigrants from Eastern Africa by Single Father Poverty
In terms of single father poverty, the demographic groups most similar to Immigrants from Eastern Africa are Bolivian (14.7%, a difference of 0.010%), Immigrants from Indonesia (14.7%, a difference of 0.13%), Immigrants from Asia (14.7%, a difference of 0.19%), Immigrants from Bolivia (14.7%, a difference of 0.29%), and Egyptian (14.7%, a difference of 0.36%).
| Demographics | Rating | Rank | Single Father Poverty |
| Thais | 100.0 /100 | #30 | Exceptional 14.5% |
| Icelanders | 100.0 /100 | #31 | Exceptional 14.5% |
| Asians | 100.0 /100 | #32 | Exceptional 14.6% |
| Okinawans | 100.0 /100 | #33 | Exceptional 14.6% |
| Egyptians | 100.0 /100 | #34 | Exceptional 14.7% |
| Immigrants | Bolivia | 100.0 /100 | #35 | Exceptional 14.7% |
| Immigrants | Indonesia | 100.0 /100 | #36 | Exceptional 14.7% |
| Immigrants | Eastern Africa | 100.0 /100 | #37 | Exceptional 14.7% |
| Bolivians | 100.0 /100 | #38 | Exceptional 14.7% |
| Immigrants | Asia | 100.0 /100 | #39 | Exceptional 14.7% |
| Pima | 100.0 /100 | #40 | Exceptional 14.8% |
| Indians (Asian) | 100.0 /100 | #41 | Exceptional 14.8% |
| Immigrants | Nepal | 100.0 /100 | #42 | Exceptional 14.8% |
| Immigrants | Eritrea | 100.0 /100 | #43 | Exceptional 14.8% |
| Salvadorans | 100.0 /100 | #44 | Exceptional 14.9% |
Demographics Similar to Pueblo by Single Father Poverty
In terms of single father poverty, the demographic groups most similar to Pueblo are Colville (21.4%, a difference of 1.1%), Choctaw (20.7%, a difference of 1.9%), Paiute (21.6%, a difference of 2.4%), Immigrants from Yemen (20.6%, a difference of 2.6%), and Central American Indian (21.7%, a difference of 2.6%).
| Demographics | Rating | Rank | Single Father Poverty |
| Cherokee | 0.0 /100 | #321 | Tragic 19.6% |
| Creek | 0.0 /100 | #322 | Tragic 19.8% |
| Pennsylvania Germans | 0.0 /100 | #323 | Tragic 20.0% |
| Americans | 0.0 /100 | #324 | Tragic 20.1% |
| Blacks/African Americans | 0.0 /100 | #325 | Tragic 20.4% |
| Immigrants | Yemen | 0.0 /100 | #326 | Tragic 20.6% |
| Choctaw | 0.0 /100 | #327 | Tragic 20.7% |
| Pueblo | 0.0 /100 | #328 | Tragic 21.1% |
| Colville | 0.0 /100 | #329 | Tragic 21.4% |
| Paiute | 0.0 /100 | #330 | Tragic 21.6% |
| Central American Indians | 0.0 /100 | #331 | Tragic 21.7% |
| Tohono O'odham | 0.0 /100 | #332 | Tragic 22.0% |
| Natives/Alaskans | 0.0 /100 | #333 | Tragic 22.4% |
| Kiowa | 0.0 /100 | #334 | Tragic 22.5% |
| Shoshone | 0.0 /100 | #335 | Tragic 22.9% |