Palestinian vs Pueblo Single Father Poverty
COMPARE
Palestinian
Pueblo
Single Father Poverty
Single Father Poverty Comparison
Palestinians
Pueblo
15.9%
SINGLE FATHER POVERTY
91.3/ 100
METRIC RATING
123rd/ 347
METRIC RANK
21.1%
SINGLE FATHER POVERTY
0.0/ 100
METRIC RATING
328th/ 347
METRIC RANK
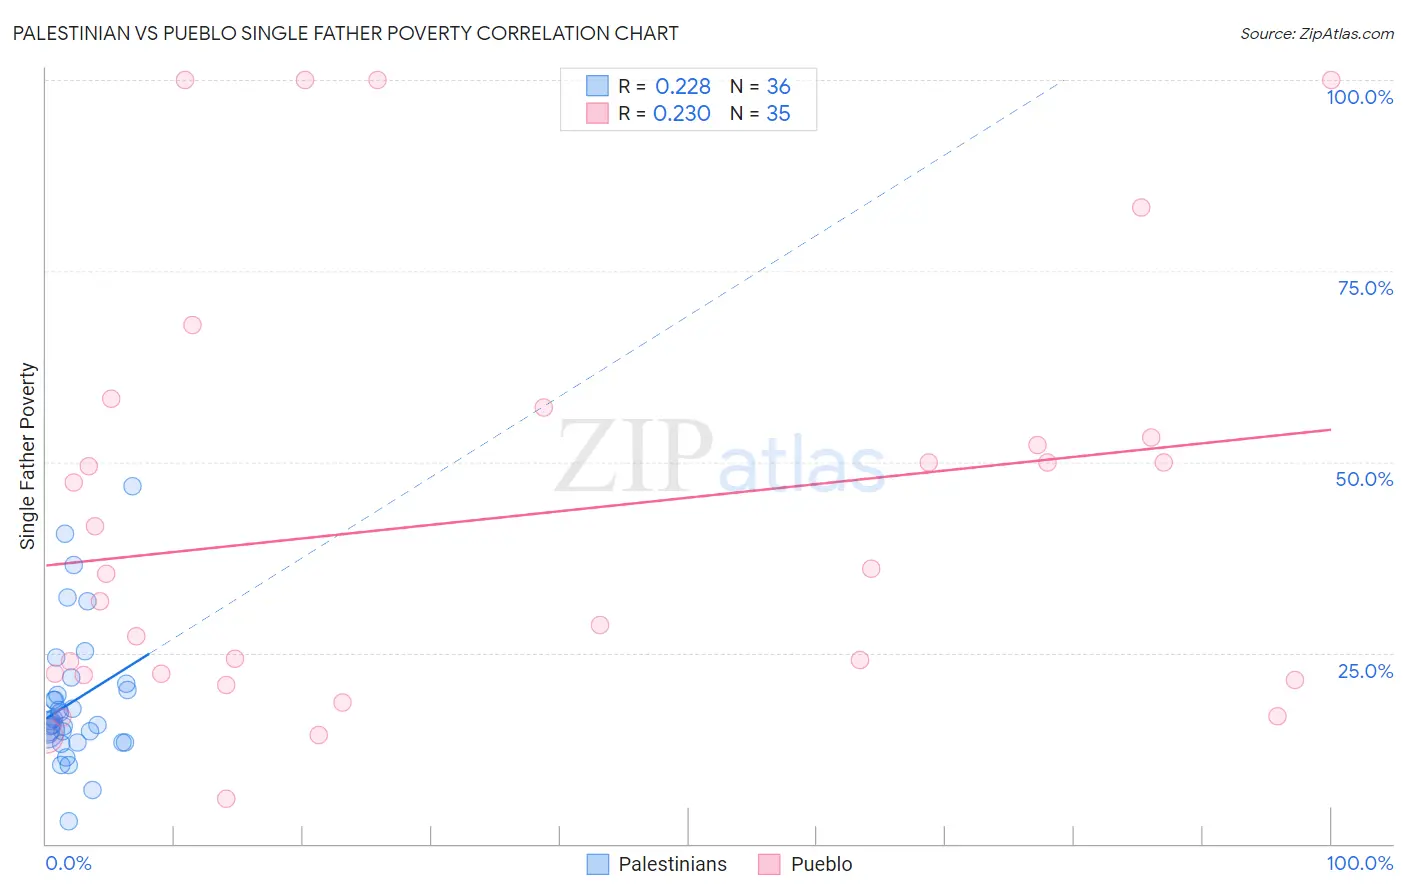
Palestinian vs Pueblo Single Father Poverty Correlation Chart
The statistical analysis conducted on geographies consisting of 184,724,489 people shows a weak positive correlation between the proportion of Palestinians and poverty level among single fathers in the United States with a correlation coefficient (R) of 0.228 and weighted average of 15.9%. Similarly, the statistical analysis conducted on geographies consisting of 109,475,284 people shows a weak positive correlation between the proportion of Pueblo and poverty level among single fathers in the United States with a correlation coefficient (R) of 0.230 and weighted average of 21.1%, a difference of 33.1%.
Single Father Poverty Correlation Summary
| Measurement | Palestinian | Pueblo |
| Minimum | 3.0% | 5.9% |
| Maximum | 46.8% | 100.0% |
| Range | 43.8% | 94.1% |
| Mean | 18.7% | 42.5% |
| Median | 15.9% | 35.3% |
| Interquartile 25% (IQ1) | 13.8% | 22.1% |
| Interquartile 75% (IQ3) | 20.5% | 53.2% |
| Interquartile Range (IQR) | 6.7% | 31.2% |
| Standard Deviation (Sample) | 9.0% | 27.2% |
| Standard Deviation (Population) | 8.9% | 26.8% |
Similar Demographics by Single Father Poverty
Demographics Similar to Palestinians by Single Father Poverty
In terms of single father poverty, the demographic groups most similar to Palestinians are Immigrants from Panama (15.9%, a difference of 0.010%), Iraqi (15.9%, a difference of 0.020%), Hmong (15.9%, a difference of 0.030%), Sudanese (15.9%, a difference of 0.040%), and Immigrants from Liberia (15.9%, a difference of 0.040%).
| Demographics | Rating | Rank | Single Father Poverty |
| Immigrants | Argentina | 92.8 /100 | #116 | Exceptional 15.8% |
| Immigrants | Colombia | 92.6 /100 | #117 | Exceptional 15.8% |
| Immigrants | Eastern Europe | 92.5 /100 | #118 | Exceptional 15.8% |
| Immigrants | Belarus | 92.4 /100 | #119 | Exceptional 15.8% |
| Uruguayans | 92.1 /100 | #120 | Exceptional 15.9% |
| Immigrants | Immigrants | 91.9 /100 | #121 | Exceptional 15.9% |
| Sudanese | 91.6 /100 | #122 | Exceptional 15.9% |
| Palestinians | 91.3 /100 | #123 | Exceptional 15.9% |
| Immigrants | Panama | 91.3 /100 | #124 | Exceptional 15.9% |
| Iraqis | 91.2 /100 | #125 | Exceptional 15.9% |
| Hmong | 91.1 /100 | #126 | Exceptional 15.9% |
| Immigrants | Liberia | 91.1 /100 | #127 | Exceptional 15.9% |
| Immigrants | Nigeria | 90.8 /100 | #128 | Exceptional 15.9% |
| Immigrants | West Indies | 90.8 /100 | #129 | Exceptional 15.9% |
| Norwegians | 90.2 /100 | #130 | Exceptional 15.9% |
Demographics Similar to Pueblo by Single Father Poverty
In terms of single father poverty, the demographic groups most similar to Pueblo are Colville (21.4%, a difference of 1.1%), Choctaw (20.7%, a difference of 1.9%), Paiute (21.6%, a difference of 2.4%), Immigrants from Yemen (20.6%, a difference of 2.6%), and Central American Indian (21.7%, a difference of 2.6%).
| Demographics | Rating | Rank | Single Father Poverty |
| Cherokee | 0.0 /100 | #321 | Tragic 19.6% |
| Creek | 0.0 /100 | #322 | Tragic 19.8% |
| Pennsylvania Germans | 0.0 /100 | #323 | Tragic 20.0% |
| Americans | 0.0 /100 | #324 | Tragic 20.1% |
| Blacks/African Americans | 0.0 /100 | #325 | Tragic 20.4% |
| Immigrants | Yemen | 0.0 /100 | #326 | Tragic 20.6% |
| Choctaw | 0.0 /100 | #327 | Tragic 20.7% |
| Pueblo | 0.0 /100 | #328 | Tragic 21.1% |
| Colville | 0.0 /100 | #329 | Tragic 21.4% |
| Paiute | 0.0 /100 | #330 | Tragic 21.6% |
| Central American Indians | 0.0 /100 | #331 | Tragic 21.7% |
| Tohono O'odham | 0.0 /100 | #332 | Tragic 22.0% |
| Natives/Alaskans | 0.0 /100 | #333 | Tragic 22.4% |
| Kiowa | 0.0 /100 | #334 | Tragic 22.5% |
| Shoshone | 0.0 /100 | #335 | Tragic 22.9% |