Immigrants from Eastern Africa vs German Single Father Poverty
COMPARE
Immigrants from Eastern Africa
German
Single Father Poverty
Single Father Poverty Comparison
Immigrants from Eastern Africa
Germans
14.7%
SINGLE FATHER POVERTY
100.0/ 100
METRIC RATING
37th/ 347
METRIC RANK
17.7%
SINGLE FATHER POVERTY
0.0/ 100
METRIC RATING
278th/ 347
METRIC RANK
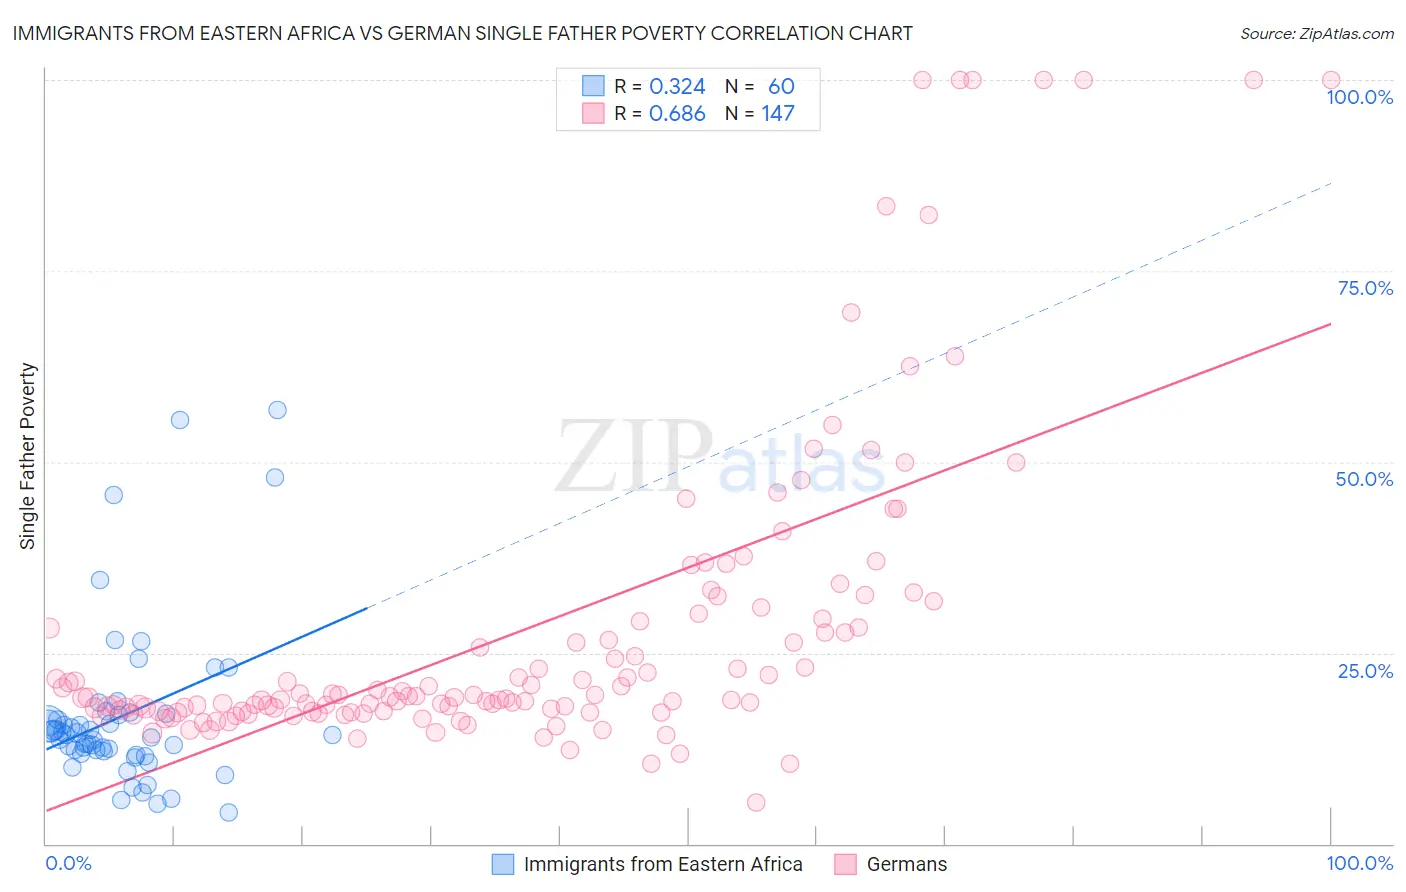
Immigrants from Eastern Africa vs German Single Father Poverty Correlation Chart
The statistical analysis conducted on geographies consisting of 287,393,274 people shows a mild positive correlation between the proportion of Immigrants from Eastern Africa and poverty level among single fathers in the United States with a correlation coefficient (R) of 0.324 and weighted average of 14.7%. Similarly, the statistical analysis conducted on geographies consisting of 412,171,316 people shows a significant positive correlation between the proportion of Germans and poverty level among single fathers in the United States with a correlation coefficient (R) of 0.686 and weighted average of 17.7%, a difference of 20.4%.
Single Father Poverty Correlation Summary
| Measurement | Immigrants from Eastern Africa | German |
| Minimum | 4.1% | 5.4% |
| Maximum | 56.8% | 100.0% |
| Range | 52.7% | 94.6% |
| Mean | 16.7% | 28.0% |
| Median | 14.3% | 19.2% |
| Interquartile 25% (IQ1) | 11.9% | 17.4% |
| Interquartile 75% (IQ3) | 16.9% | 29.5% |
| Interquartile Range (IQR) | 5.0% | 12.1% |
| Standard Deviation (Sample) | 10.8% | 20.7% |
| Standard Deviation (Population) | 10.8% | 20.6% |
Similar Demographics by Single Father Poverty
Demographics Similar to Immigrants from Eastern Africa by Single Father Poverty
In terms of single father poverty, the demographic groups most similar to Immigrants from Eastern Africa are Bolivian (14.7%, a difference of 0.010%), Immigrants from Indonesia (14.7%, a difference of 0.13%), Immigrants from Asia (14.7%, a difference of 0.19%), Immigrants from Bolivia (14.7%, a difference of 0.29%), and Egyptian (14.7%, a difference of 0.36%).
| Demographics | Rating | Rank | Single Father Poverty |
| Thais | 100.0 /100 | #30 | Exceptional 14.5% |
| Icelanders | 100.0 /100 | #31 | Exceptional 14.5% |
| Asians | 100.0 /100 | #32 | Exceptional 14.6% |
| Okinawans | 100.0 /100 | #33 | Exceptional 14.6% |
| Egyptians | 100.0 /100 | #34 | Exceptional 14.7% |
| Immigrants | Bolivia | 100.0 /100 | #35 | Exceptional 14.7% |
| Immigrants | Indonesia | 100.0 /100 | #36 | Exceptional 14.7% |
| Immigrants | Eastern Africa | 100.0 /100 | #37 | Exceptional 14.7% |
| Bolivians | 100.0 /100 | #38 | Exceptional 14.7% |
| Immigrants | Asia | 100.0 /100 | #39 | Exceptional 14.7% |
| Pima | 100.0 /100 | #40 | Exceptional 14.8% |
| Indians (Asian) | 100.0 /100 | #41 | Exceptional 14.8% |
| Immigrants | Nepal | 100.0 /100 | #42 | Exceptional 14.8% |
| Immigrants | Eritrea | 100.0 /100 | #43 | Exceptional 14.8% |
| Salvadorans | 100.0 /100 | #44 | Exceptional 14.9% |
Demographics Similar to Germans by Single Father Poverty
In terms of single father poverty, the demographic groups most similar to Germans are Lebanese (17.7%, a difference of 0.010%), Iroquois (17.7%, a difference of 0.15%), German Russian (17.7%, a difference of 0.16%), Scottish (17.7%, a difference of 0.19%), and British West Indian (17.7%, a difference of 0.22%).
| Demographics | Rating | Rank | Single Father Poverty |
| French American Indians | 0.2 /100 | #271 | Tragic 17.4% |
| Barbadians | 0.1 /100 | #272 | Tragic 17.5% |
| Italians | 0.1 /100 | #273 | Tragic 17.5% |
| Macedonians | 0.1 /100 | #274 | Tragic 17.7% |
| British West Indians | 0.0 /100 | #275 | Tragic 17.7% |
| German Russians | 0.0 /100 | #276 | Tragic 17.7% |
| Lebanese | 0.0 /100 | #277 | Tragic 17.7% |
| Germans | 0.0 /100 | #278 | Tragic 17.7% |
| Iroquois | 0.0 /100 | #279 | Tragic 17.7% |
| Scottish | 0.0 /100 | #280 | Tragic 17.7% |
| English | 0.0 /100 | #281 | Tragic 17.8% |
| Dutch | 0.0 /100 | #282 | Tragic 17.8% |
| Alsatians | 0.0 /100 | #283 | Tragic 17.8% |
| Welsh | 0.0 /100 | #284 | Tragic 17.8% |
| Immigrants | Lebanon | 0.0 /100 | #285 | Tragic 17.9% |