Immigrants from Eastern Africa vs Assyrian/Chaldean/Syriac 1st Grade
COMPARE
Immigrants from Eastern Africa
Assyrian/Chaldean/Syriac
1st Grade
1st Grade Comparison
Immigrants from Eastern Africa
Assyrians/Chaldeans/Syriacs
97.6%
1ST GRADE
1.0/ 100
METRIC RATING
246th/ 347
METRIC RANK
97.5%
1ST GRADE
0.4/ 100
METRIC RATING
262nd/ 347
METRIC RANK
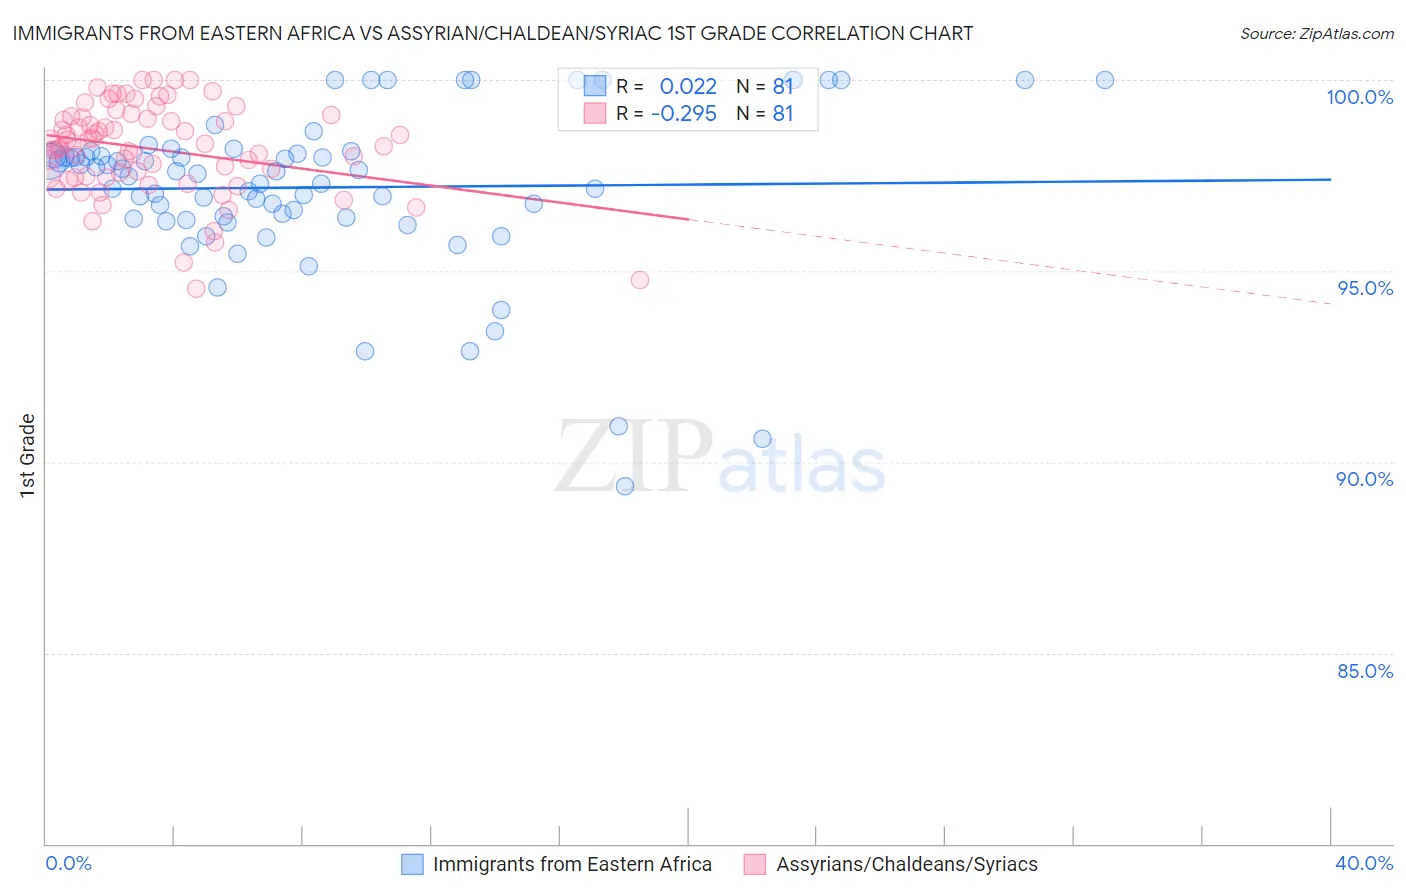
Immigrants from Eastern Africa vs Assyrian/Chaldean/Syriac 1st Grade Correlation Chart
The statistical analysis conducted on geographies consisting of 355,144,184 people shows no correlation between the proportion of Immigrants from Eastern Africa and percentage of population with at least 1st grade education in the United States with a correlation coefficient (R) of 0.022 and weighted average of 97.6%. Similarly, the statistical analysis conducted on geographies consisting of 110,318,304 people shows a weak negative correlation between the proportion of Assyrians/Chaldeans/Syriacs and percentage of population with at least 1st grade education in the United States with a correlation coefficient (R) of -0.295 and weighted average of 97.5%, a difference of 0.070%.
1st Grade Correlation Summary
| Measurement | Immigrants from Eastern Africa | Assyrian/Chaldean/Syriac |
| Minimum | 89.4% | 94.5% |
| Maximum | 100.0% | 100.0% |
| Range | 10.6% | 5.5% |
| Mean | 97.2% | 98.2% |
| Median | 97.6% | 98.3% |
| Interquartile 25% (IQ1) | 96.4% | 97.4% |
| Interquartile 75% (IQ3) | 98.1% | 99.0% |
| Interquartile Range (IQR) | 1.7% | 1.6% |
| Standard Deviation (Sample) | 2.1% | 1.2% |
| Standard Deviation (Population) | 2.1% | 1.2% |
Demographics Similar to Immigrants from Eastern Africa and Assyrians/Chaldeans/Syriacs by 1st Grade
In terms of 1st grade, the demographic groups most similar to Immigrants from Eastern Africa are Asian (97.6%, a difference of 0.0%), South American (97.6%, a difference of 0.0%), Peruvian (97.6%, a difference of 0.0%), Immigrants from Middle Africa (97.6%, a difference of 0.0%), and Immigrants from Senegal (97.6%, a difference of 0.0%). Similarly, the demographic groups most similar to Assyrians/Chaldeans/Syriacs are Immigrants from Ethiopia (97.5%, a difference of 0.0%), Immigrants from South America (97.5%, a difference of 0.0%), Taiwanese (97.5%, a difference of 0.0%), Fijian (97.5%, a difference of 0.010%), and Armenian (97.5%, a difference of 0.010%).
| Demographics | Rating | Rank | 1st Grade |
| Asians | 1.1 /100 | #244 | Tragic 97.6% |
| South Americans | 1.1 /100 | #245 | Tragic 97.6% |
| Immigrants | Eastern Africa | 1.0 /100 | #246 | Tragic 97.6% |
| Peruvians | 1.0 /100 | #247 | Tragic 97.6% |
| Immigrants | Middle Africa | 1.0 /100 | #248 | Tragic 97.6% |
| Immigrants | Senegal | 1.0 /100 | #249 | Tragic 97.6% |
| Ethiopians | 0.9 /100 | #250 | Tragic 97.6% |
| Immigrants | Iraq | 0.9 /100 | #251 | Tragic 97.6% |
| Immigrants | Africa | 0.9 /100 | #252 | Tragic 97.6% |
| Immigrants | Congo | 0.7 /100 | #253 | Tragic 97.5% |
| Immigrants | Asia | 0.7 /100 | #254 | Tragic 97.5% |
| Immigrants | Colombia | 0.6 /100 | #255 | Tragic 97.5% |
| Jamaicans | 0.6 /100 | #256 | Tragic 97.5% |
| Yaqui | 0.6 /100 | #257 | Tragic 97.5% |
| Indians (Asian) | 0.6 /100 | #258 | Tragic 97.5% |
| Fijians | 0.5 /100 | #259 | Tragic 97.5% |
| Armenians | 0.5 /100 | #260 | Tragic 97.5% |
| Immigrants | Ethiopia | 0.4 /100 | #261 | Tragic 97.5% |
| Assyrians/Chaldeans/Syriacs | 0.4 /100 | #262 | Tragic 97.5% |
| Immigrants | South America | 0.4 /100 | #263 | Tragic 97.5% |
| Taiwanese | 0.4 /100 | #264 | Tragic 97.5% |