Immigrants from Dominican Republic vs Dominican Female Poverty Among 18-24 Year Olds
COMPARE
Immigrants from Dominican Republic
Dominican
Female Poverty Among 18-24 Year Olds
Female Poverty Among 18-24 Year Olds Comparison
Immigrants from Dominican Republic
Dominicans
21.9%
FEMALE POVERTY AMONG 18-24 YEAR OLDS
0.1/ 100
METRIC RATING
281st/ 347
METRIC RANK
22.3%
FEMALE POVERTY AMONG 18-24 YEAR OLDS
0.0/ 100
METRIC RATING
288th/ 347
METRIC RANK
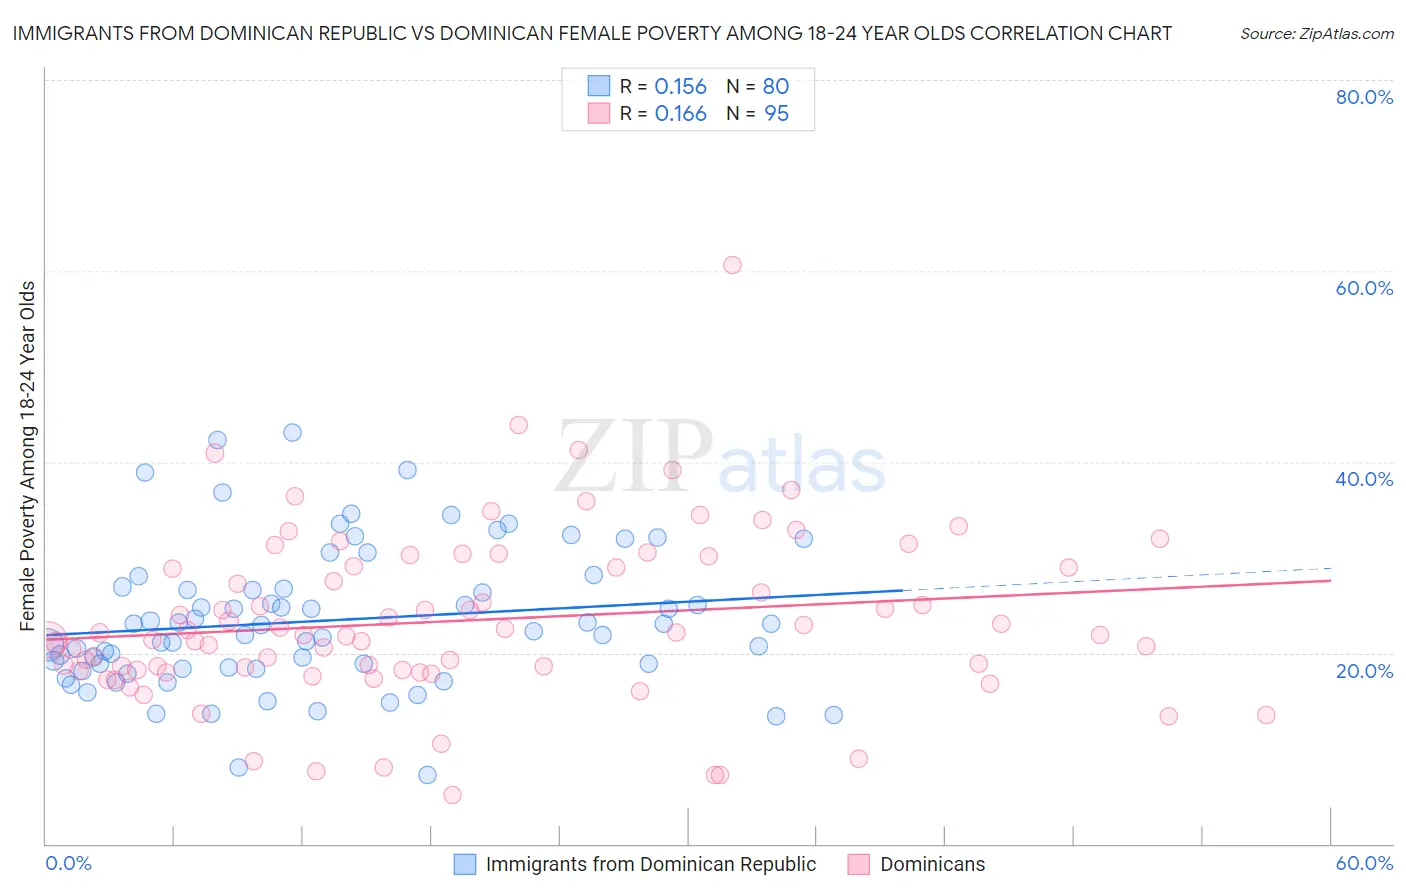
Immigrants from Dominican Republic vs Dominican Female Poverty Among 18-24 Year Olds Correlation Chart
The statistical analysis conducted on geographies consisting of 269,456,906 people shows a poor positive correlation between the proportion of Immigrants from Dominican Republic and poverty level among females between the ages 18 and 24 in the United States with a correlation coefficient (R) of 0.156 and weighted average of 21.9%. Similarly, the statistical analysis conducted on geographies consisting of 346,732,466 people shows a poor positive correlation between the proportion of Dominicans and poverty level among females between the ages 18 and 24 in the United States with a correlation coefficient (R) of 0.166 and weighted average of 22.3%, a difference of 1.5%.
Female Poverty Among 18-24 Year Olds Correlation Summary
| Measurement | Immigrants from Dominican Republic | Dominican |
| Minimum | 7.2% | 5.1% |
| Maximum | 43.1% | 60.6% |
| Range | 35.8% | 55.5% |
| Mean | 23.4% | 23.4% |
| Median | 22.5% | 21.9% |
| Interquartile 25% (IQ1) | 18.4% | 18.1% |
| Interquartile 75% (IQ3) | 26.8% | 29.1% |
| Interquartile Range (IQR) | 8.4% | 11.0% |
| Standard Deviation (Sample) | 7.4% | 9.0% |
| Standard Deviation (Population) | 7.4% | 8.9% |
Demographics Similar to Immigrants from Dominican Republic and Dominicans by Female Poverty Among 18-24 Year Olds
In terms of female poverty among 18-24 year olds, the demographic groups most similar to Immigrants from Dominican Republic are Immigrants from Dominica (21.9%, a difference of 0.040%), Spanish American (21.9%, a difference of 0.050%), Bermudan (21.9%, a difference of 0.090%), Yaqui (21.9%, a difference of 0.22%), and Subsaharan African (22.0%, a difference of 0.39%). Similarly, the demographic groups most similar to Dominicans are French American Indian (22.3%, a difference of 0.070%), Immigrants from Senegal (22.4%, a difference of 0.66%), Immigrants from Middle Africa (22.1%, a difference of 0.75%), Ugandan (22.1%, a difference of 0.77%), and Bangladeshi (22.5%, a difference of 0.93%).
| Demographics | Rating | Rank | Female Poverty Among 18-24 Year Olds |
| Immigrants | Honduras | 0.1 /100 | #274 | Tragic 21.8% |
| Immigrants | Bangladesh | 0.1 /100 | #275 | Tragic 21.8% |
| Bahamians | 0.1 /100 | #276 | Tragic 21.8% |
| Immigrants | Switzerland | 0.1 /100 | #277 | Tragic 21.8% |
| Yaqui | 0.1 /100 | #278 | Tragic 21.9% |
| Spanish Americans | 0.1 /100 | #279 | Tragic 21.9% |
| Immigrants | Dominica | 0.1 /100 | #280 | Tragic 21.9% |
| Immigrants | Dominican Republic | 0.1 /100 | #281 | Tragic 21.9% |
| Bermudans | 0.1 /100 | #282 | Tragic 21.9% |
| Sub-Saharan Africans | 0.0 /100 | #283 | Tragic 22.0% |
| Tlingit-Haida | 0.0 /100 | #284 | Tragic 22.0% |
| Ottawa | 0.0 /100 | #285 | Tragic 22.0% |
| Ugandans | 0.0 /100 | #286 | Tragic 22.1% |
| Immigrants | Middle Africa | 0.0 /100 | #287 | Tragic 22.1% |
| Dominicans | 0.0 /100 | #288 | Tragic 22.3% |
| French American Indians | 0.0 /100 | #289 | Tragic 22.3% |
| Immigrants | Senegal | 0.0 /100 | #290 | Tragic 22.4% |
| Bangladeshis | 0.0 /100 | #291 | Tragic 22.5% |
| Alaskan Athabascans | 0.0 /100 | #292 | Tragic 22.5% |
| U.S. Virgin Islanders | 0.0 /100 | #293 | Tragic 22.5% |
| Indonesians | 0.0 /100 | #294 | Tragic 22.5% |