Immigrants from Dominican Republic vs Malaysian Child Poverty Under the Age of 5
COMPARE
Immigrants from Dominican Republic
Malaysian
Child Poverty Under the Age of 5
Child Poverty Under the Age of 5 Comparison
Immigrants from Dominican Republic
Malaysians
24.1%
CHILD POVERTY UNDER THE AGE OF 5
0.0/ 100
METRIC RATING
328th/ 347
METRIC RANK
18.4%
CHILD POVERTY UNDER THE AGE OF 5
6.5/ 100
METRIC RATING
214th/ 347
METRIC RANK
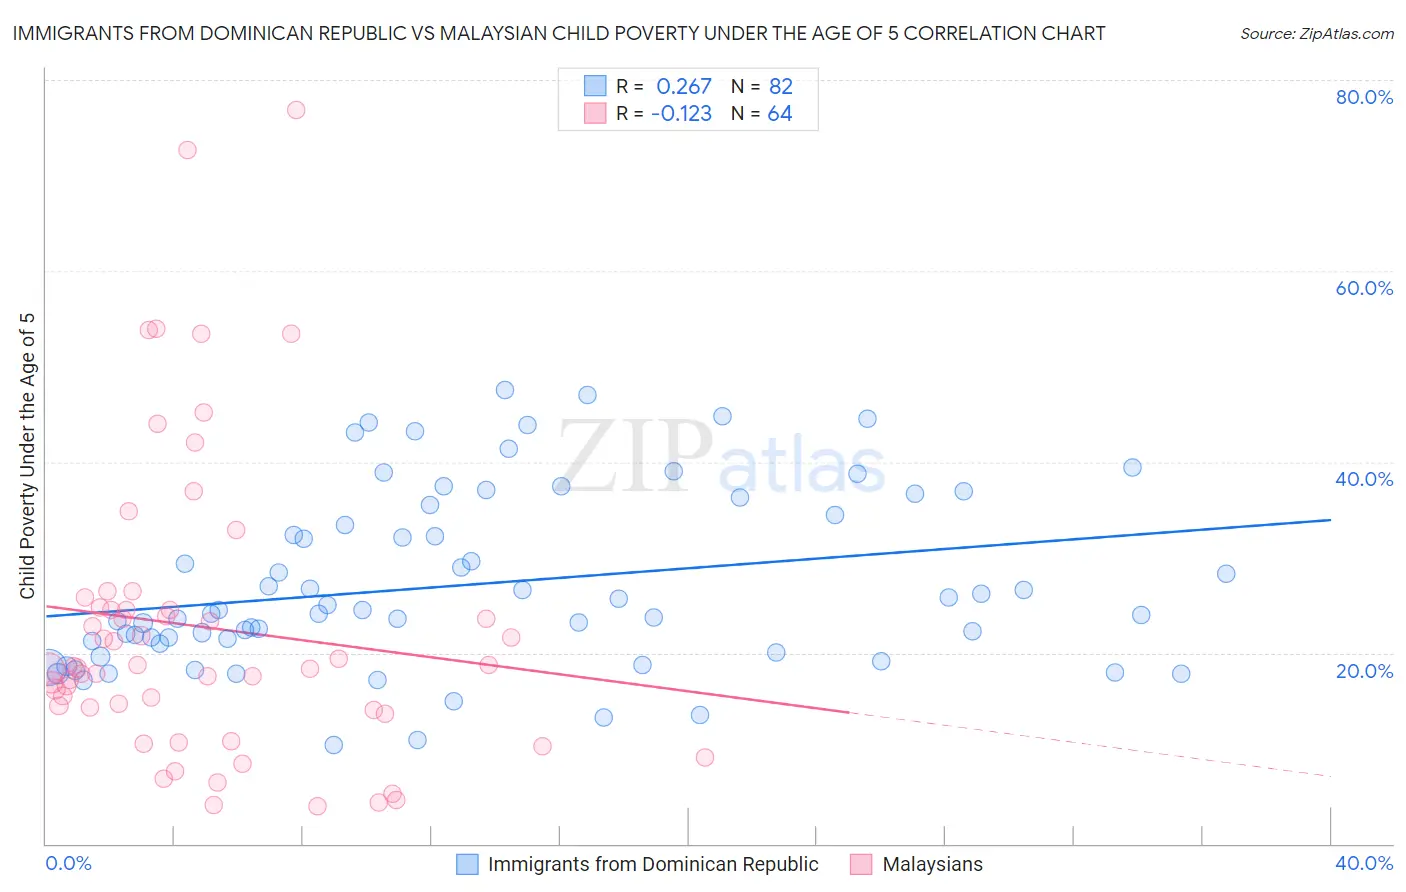
Immigrants from Dominican Republic vs Malaysian Child Poverty Under the Age of 5 Correlation Chart
The statistical analysis conducted on geographies consisting of 266,224,644 people shows a weak positive correlation between the proportion of Immigrants from Dominican Republic and poverty level among children under the age of 5 in the United States with a correlation coefficient (R) of 0.267 and weighted average of 24.1%. Similarly, the statistical analysis conducted on geographies consisting of 221,749,589 people shows a poor negative correlation between the proportion of Malaysians and poverty level among children under the age of 5 in the United States with a correlation coefficient (R) of -0.123 and weighted average of 18.4%, a difference of 30.5%.
Child Poverty Under the Age of 5 Correlation Summary
| Measurement | Immigrants from Dominican Republic | Malaysian |
| Minimum | 10.3% | 4.0% |
| Maximum | 47.5% | 76.9% |
| Range | 37.2% | 73.0% |
| Mean | 27.1% | 22.7% |
| Median | 24.3% | 18.5% |
| Interquartile 25% (IQ1) | 20.9% | 14.1% |
| Interquartile 75% (IQ3) | 34.4% | 24.6% |
| Interquartile Range (IQR) | 13.5% | 10.5% |
| Standard Deviation (Sample) | 9.2% | 15.6% |
| Standard Deviation (Population) | 9.1% | 15.5% |
Similar Demographics by Child Poverty Under the Age of 5
Demographics Similar to Immigrants from Dominican Republic by Child Poverty Under the Age of 5
In terms of child poverty under the age of 5, the demographic groups most similar to Immigrants from Dominican Republic are Dominican (24.0%, a difference of 0.090%), Cajun (24.1%, a difference of 0.23%), Central American Indian (23.9%, a difference of 0.55%), Creek (24.2%, a difference of 0.67%), and Immigrants from Congo (23.9%, a difference of 0.73%).
| Demographics | Rating | Rank | Child Poverty Under the Age of 5 |
| Immigrants | Honduras | 0.0 /100 | #321 | Tragic 23.5% |
| Ute | 0.0 /100 | #322 | Tragic 23.5% |
| Pueblo | 0.0 /100 | #323 | Tragic 23.7% |
| Paiute | 0.0 /100 | #324 | Tragic 23.8% |
| Immigrants | Congo | 0.0 /100 | #325 | Tragic 23.9% |
| Central American Indians | 0.0 /100 | #326 | Tragic 23.9% |
| Dominicans | 0.0 /100 | #327 | Tragic 24.0% |
| Immigrants | Dominican Republic | 0.0 /100 | #328 | Tragic 24.1% |
| Cajuns | 0.0 /100 | #329 | Tragic 24.1% |
| Creek | 0.0 /100 | #330 | Tragic 24.2% |
| Kiowa | 0.0 /100 | #331 | Tragic 24.5% |
| Apache | 0.0 /100 | #332 | Tragic 25.0% |
| Natives/Alaskans | 0.0 /100 | #333 | Tragic 25.6% |
| Blacks/African Americans | 0.0 /100 | #334 | Tragic 25.7% |
| Colville | 0.0 /100 | #335 | Tragic 25.7% |
Demographics Similar to Malaysians by Child Poverty Under the Age of 5
In terms of child poverty under the age of 5, the demographic groups most similar to Malaysians are Immigrants from Panama (18.5%, a difference of 0.20%), Hmong (18.5%, a difference of 0.66%), Immigrants from Thailand (18.3%, a difference of 0.76%), Nepalese (18.3%, a difference of 0.78%), and Immigrants from Africa (18.6%, a difference of 0.87%).
| Demographics | Rating | Rank | Child Poverty Under the Age of 5 |
| Immigrants | Immigrants | 9.9 /100 | #207 | Tragic 18.2% |
| Scotch-Irish | 9.8 /100 | #208 | Tragic 18.2% |
| Spanish | 9.8 /100 | #209 | Tragic 18.2% |
| Panamanians | 9.7 /100 | #210 | Tragic 18.2% |
| Moroccans | 9.4 /100 | #211 | Tragic 18.2% |
| Nepalese | 8.7 /100 | #212 | Tragic 18.3% |
| Immigrants | Thailand | 8.6 /100 | #213 | Tragic 18.3% |
| Malaysians | 6.5 /100 | #214 | Tragic 18.4% |
| Immigrants | Panama | 6.0 /100 | #215 | Tragic 18.5% |
| Hmong | 5.0 /100 | #216 | Tragic 18.5% |
| Immigrants | Africa | 4.6 /100 | #217 | Tragic 18.6% |
| Delaware | 3.4 /100 | #218 | Tragic 18.7% |
| German Russians | 3.0 /100 | #219 | Tragic 18.8% |
| Immigrants | Azores | 2.6 /100 | #220 | Tragic 18.9% |
| Immigrants | Nigeria | 2.1 /100 | #221 | Tragic 19.0% |