Immigrants from Dominica vs Mexican American Indian Householder Income Ages 25 - 44 years
COMPARE
Immigrants from Dominica
Mexican American Indian
Householder Income Ages 25 - 44 years
Householder Income Ages 25 - 44 years Comparison
Immigrants from Dominica
Mexican American Indians
$81,351
HOUSEHOLDER INCOME AGES 25 - 44 YEARS
0.1/ 100
METRIC RATING
296th/ 347
METRIC RANK
$85,066
HOUSEHOLDER INCOME AGES 25 - 44 YEARS
0.5/ 100
METRIC RATING
257th/ 347
METRIC RANK
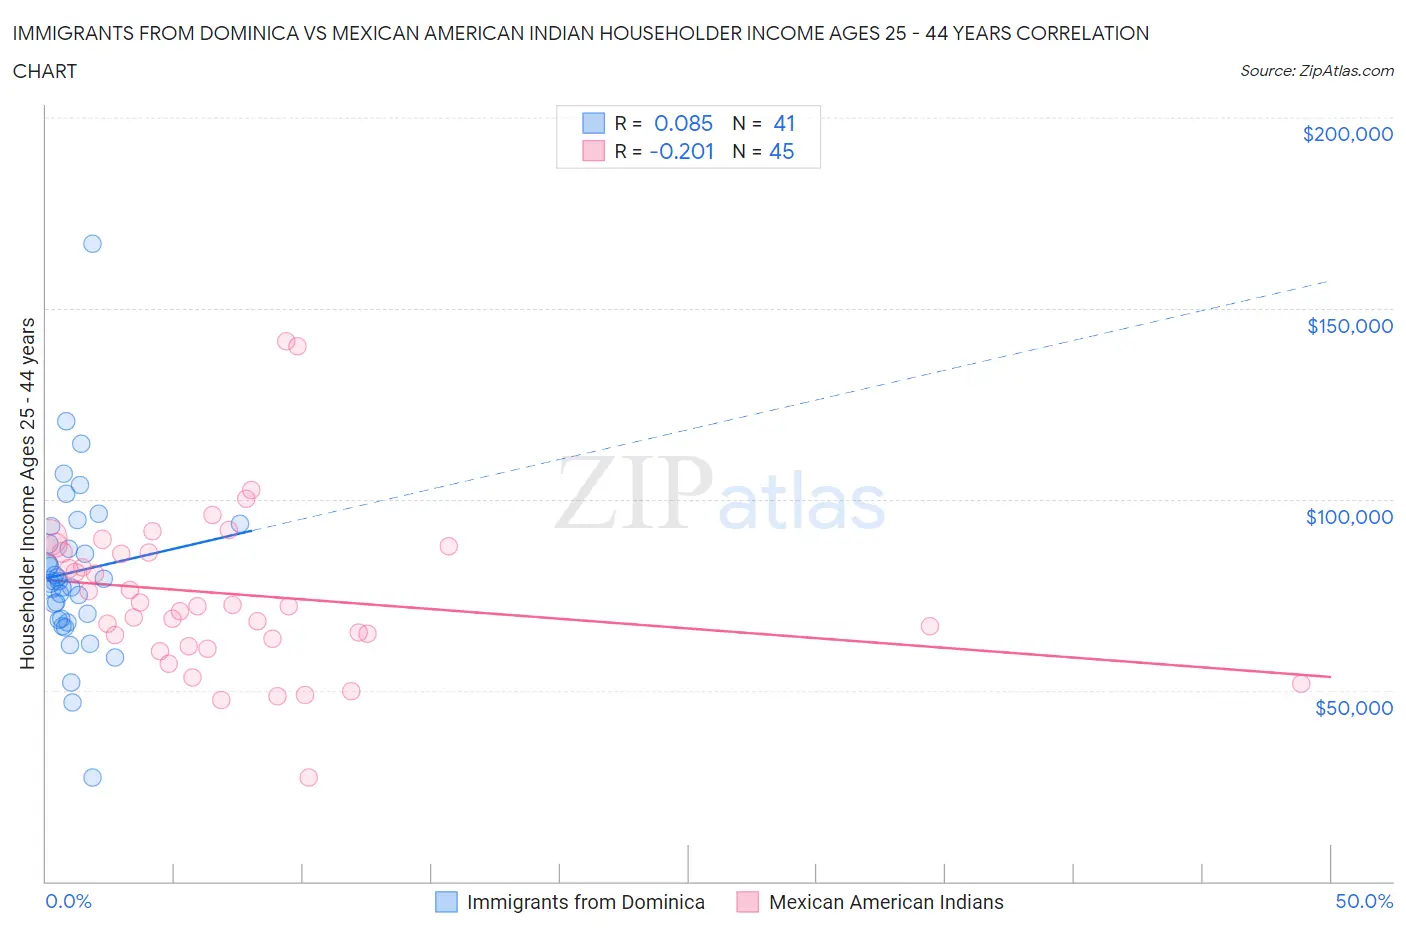
Immigrants from Dominica vs Mexican American Indian Householder Income Ages 25 - 44 years Correlation Chart
The statistical analysis conducted on geographies consisting of 83,772,470 people shows a slight positive correlation between the proportion of Immigrants from Dominica and household income with householder between the ages 25 and 44 in the United States with a correlation coefficient (R) of 0.085 and weighted average of $81,351. Similarly, the statistical analysis conducted on geographies consisting of 317,167,335 people shows a weak negative correlation between the proportion of Mexican American Indians and household income with householder between the ages 25 and 44 in the United States with a correlation coefficient (R) of -0.201 and weighted average of $85,066, a difference of 4.6%.
Householder Income Ages 25 - 44 years Correlation Summary
| Measurement | Immigrants from Dominica | Mexican American Indian |
| Minimum | $27,269 | $27,125 |
| Maximum | $167,054 | $141,536 |
| Range | $139,785 | $114,411 |
| Mean | $80,956 | $75,117 |
| Median | $78,585 | $72,064 |
| Interquartile 25% (IQ1) | $68,699 | $62,611 |
| Interquartile 75% (IQ3) | $90,712 | $86,929 |
| Interquartile Range (IQR) | $22,013 | $24,319 |
| Standard Deviation (Sample) | $22,322 | $21,361 |
| Standard Deviation (Population) | $22,048 | $21,122 |
Similar Demographics by Householder Income Ages 25 - 44 years
Demographics Similar to Immigrants from Dominica by Householder Income Ages 25 - 44 years
In terms of householder income ages 25 - 44 years, the demographic groups most similar to Immigrants from Dominica are Immigrants from Guatemala ($81,341, a difference of 0.010%), Bangladeshi ($81,363, a difference of 0.020%), Dominican ($81,229, a difference of 0.15%), Cuban ($81,483, a difference of 0.16%), and Blackfeet ($81,531, a difference of 0.22%).
| Demographics | Rating | Rank | Householder Income Ages 25 - 44 years |
| Shoshone | 0.1 /100 | #289 | Tragic $82,062 |
| Liberians | 0.1 /100 | #290 | Tragic $82,005 |
| Potawatomi | 0.1 /100 | #291 | Tragic $81,774 |
| Yaqui | 0.1 /100 | #292 | Tragic $81,656 |
| Blackfeet | 0.1 /100 | #293 | Tragic $81,531 |
| Cubans | 0.1 /100 | #294 | Tragic $81,483 |
| Bangladeshis | 0.1 /100 | #295 | Tragic $81,363 |
| Immigrants | Dominica | 0.1 /100 | #296 | Tragic $81,351 |
| Immigrants | Guatemala | 0.1 /100 | #297 | Tragic $81,341 |
| Dominicans | 0.1 /100 | #298 | Tragic $81,229 |
| Immigrants | Liberia | 0.1 /100 | #299 | Tragic $80,863 |
| Cherokee | 0.0 /100 | #300 | Tragic $80,843 |
| Immigrants | Micronesia | 0.0 /100 | #301 | Tragic $80,544 |
| Hispanics or Latinos | 0.0 /100 | #302 | Tragic $80,515 |
| Mexicans | 0.0 /100 | #303 | Tragic $80,427 |
Demographics Similar to Mexican American Indians by Householder Income Ages 25 - 44 years
In terms of householder income ages 25 - 44 years, the demographic groups most similar to Mexican American Indians are Central American ($85,144, a difference of 0.090%), German Russian ($85,220, a difference of 0.18%), Immigrants from Nicaragua ($84,914, a difference of 0.18%), Immigrants from Senegal ($84,848, a difference of 0.26%), and American ($84,791, a difference of 0.32%).
| Demographics | Rating | Rank | Householder Income Ages 25 - 44 years |
| Pennsylvania Germans | 0.8 /100 | #250 | Tragic $85,836 |
| Cape Verdeans | 0.8 /100 | #251 | Tragic $85,758 |
| Immigrants | Western Africa | 0.7 /100 | #252 | Tragic $85,676 |
| British West Indians | 0.7 /100 | #253 | Tragic $85,565 |
| Immigrants | Laos | 0.7 /100 | #254 | Tragic $85,553 |
| German Russians | 0.6 /100 | #255 | Tragic $85,220 |
| Central Americans | 0.5 /100 | #256 | Tragic $85,144 |
| Mexican American Indians | 0.5 /100 | #257 | Tragic $85,066 |
| Immigrants | Nicaragua | 0.5 /100 | #258 | Tragic $84,914 |
| Immigrants | Senegal | 0.5 /100 | #259 | Tragic $84,848 |
| Americans | 0.4 /100 | #260 | Tragic $84,791 |
| Inupiat | 0.4 /100 | #261 | Tragic $84,619 |
| Cree | 0.4 /100 | #262 | Tragic $84,574 |
| Belizeans | 0.4 /100 | #263 | Tragic $84,534 |
| Osage | 0.4 /100 | #264 | Tragic $84,461 |