Pennsylvania German vs Mexican American Indian Single Mother Poverty
COMPARE
Pennsylvania German
Mexican American Indian
Single Mother Poverty
Single Mother Poverty Comparison
Pennsylvania Germans
Mexican American Indians
33.2%
SINGLE MOTHER POVERTY
0.0/ 100
METRIC RATING
297th/ 347
METRIC RANK
31.9%
SINGLE MOTHER POVERTY
0.0/ 100
METRIC RATING
277th/ 347
METRIC RANK
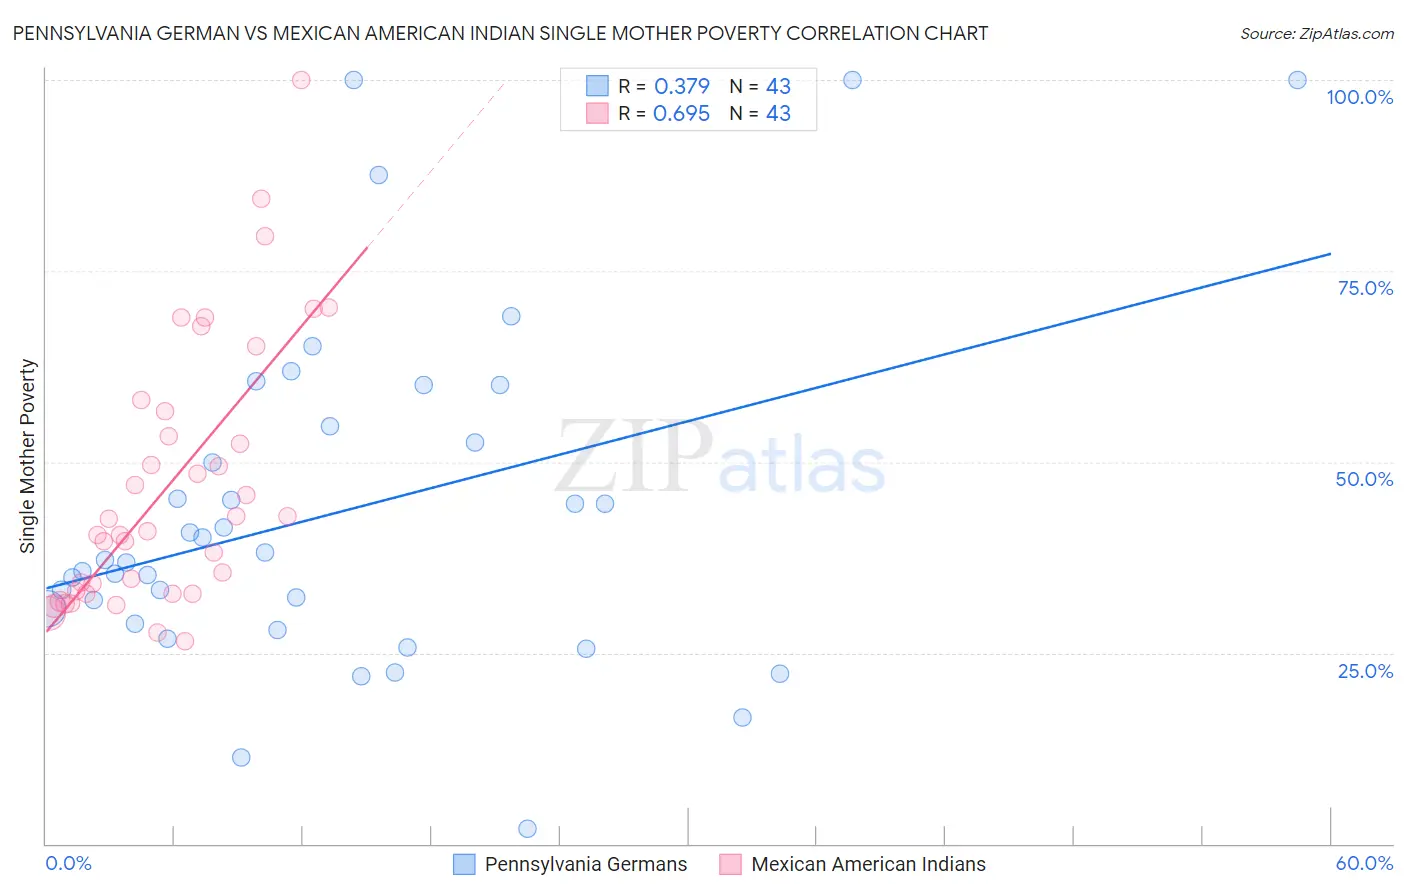
Pennsylvania German vs Mexican American Indian Single Mother Poverty Correlation Chart
The statistical analysis conducted on geographies consisting of 229,321,350 people shows a mild positive correlation between the proportion of Pennsylvania Germans and poverty level among single mothers in the United States with a correlation coefficient (R) of 0.379 and weighted average of 33.2%. Similarly, the statistical analysis conducted on geographies consisting of 314,019,371 people shows a significant positive correlation between the proportion of Mexican American Indians and poverty level among single mothers in the United States with a correlation coefficient (R) of 0.695 and weighted average of 31.9%, a difference of 4.2%.
Single Mother Poverty Correlation Summary
| Measurement | Pennsylvania German | Mexican American Indian |
| Minimum | 1.9% | 26.5% |
| Maximum | 100.0% | 100.0% |
| Range | 98.1% | 73.5% |
| Mean | 43.4% | 46.8% |
| Median | 37.2% | 41.0% |
| Interquartile 25% (IQ1) | 28.9% | 32.8% |
| Interquartile 75% (IQ3) | 54.6% | 56.6% |
| Interquartile Range (IQR) | 25.7% | 23.8% |
| Standard Deviation (Sample) | 22.5% | 17.2% |
| Standard Deviation (Population) | 22.3% | 17.0% |
Demographics Similar to Pennsylvania Germans and Mexican American Indians by Single Mother Poverty
In terms of single mother poverty, the demographic groups most similar to Pennsylvania Germans are Blackfeet (33.2%, a difference of 0.14%), Yaqui (33.1%, a difference of 0.30%), French American Indian (33.1%, a difference of 0.33%), Aleut (32.9%, a difference of 0.96%), and Shoshone (32.9%, a difference of 0.99%). Similarly, the demographic groups most similar to Mexican American Indians are Immigrants from Zaire (32.0%, a difference of 0.22%), Marshallese (32.1%, a difference of 0.63%), Nonimmigrants (32.2%, a difference of 0.84%), Cree (32.2%, a difference of 0.87%), and Immigrants from the Azores (32.2%, a difference of 0.98%).
| Demographics | Rating | Rank | Single Mother Poverty |
| Mexican American Indians | 0.0 /100 | #277 | Tragic 31.9% |
| Immigrants | Zaire | 0.0 /100 | #278 | Tragic 32.0% |
| Marshallese | 0.0 /100 | #279 | Tragic 32.1% |
| Immigrants | Nonimmigrants | 0.0 /100 | #280 | Tragic 32.2% |
| Cree | 0.0 /100 | #281 | Tragic 32.2% |
| Immigrants | Azores | 0.0 /100 | #282 | Tragic 32.2% |
| Spanish Americans | 0.0 /100 | #283 | Tragic 32.3% |
| Indonesians | 0.0 /100 | #284 | Tragic 32.4% |
| Immigrants | Latin America | 0.0 /100 | #285 | Tragic 32.4% |
| Yup'ik | 0.0 /100 | #286 | Tragic 32.5% |
| Immigrants | Dominica | 0.0 /100 | #287 | Tragic 32.5% |
| Somalis | 0.0 /100 | #288 | Tragic 32.6% |
| U.S. Virgin Islanders | 0.0 /100 | #289 | Tragic 32.6% |
| Osage | 0.0 /100 | #290 | Tragic 32.6% |
| Guatemalans | 0.0 /100 | #291 | Tragic 32.9% |
| Shoshone | 0.0 /100 | #292 | Tragic 32.9% |
| Aleuts | 0.0 /100 | #293 | Tragic 32.9% |
| French American Indians | 0.0 /100 | #294 | Tragic 33.1% |
| Yaqui | 0.0 /100 | #295 | Tragic 33.1% |
| Blackfeet | 0.0 /100 | #296 | Tragic 33.2% |
| Pennsylvania Germans | 0.0 /100 | #297 | Tragic 33.2% |