Immigrants from Czechoslovakia vs Serbian Child Poverty Among Boys Under 16
COMPARE
Immigrants from Czechoslovakia
Serbian
Child Poverty Among Boys Under 16
Child Poverty Among Boys Under 16 Comparison
Immigrants from Czechoslovakia
Serbians
14.4%
CHILD POVERTY AMONG BOYS UNDER 16
98.9/ 100
METRIC RATING
59th/ 347
METRIC RANK
15.1%
CHILD POVERTY AMONG BOYS UNDER 16
95.2/ 100
METRIC RATING
106th/ 347
METRIC RANK
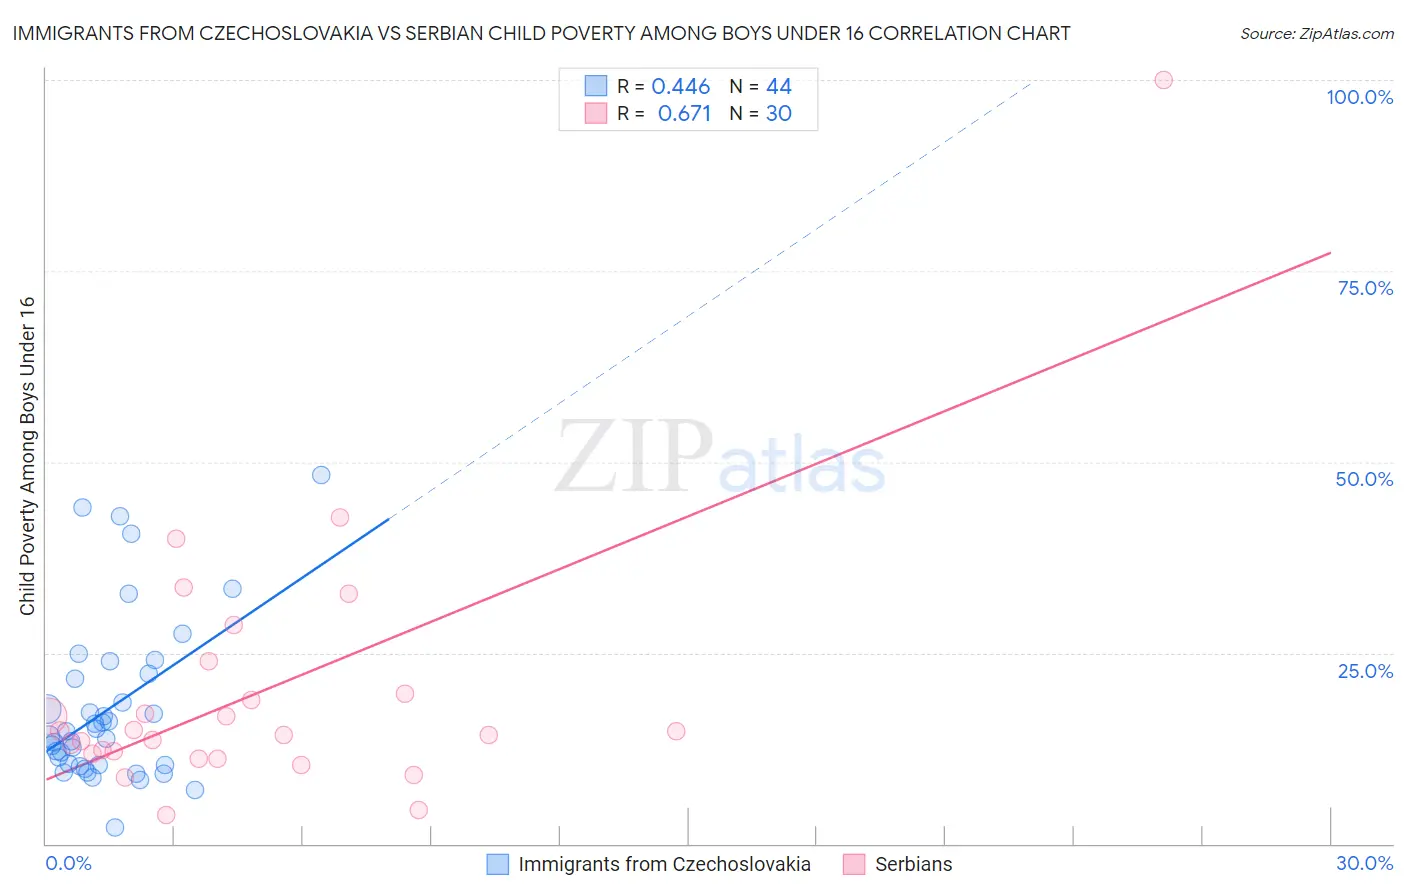
Immigrants from Czechoslovakia vs Serbian Child Poverty Among Boys Under 16 Correlation Chart
The statistical analysis conducted on geographies consisting of 192,998,028 people shows a moderate positive correlation between the proportion of Immigrants from Czechoslovakia and poverty level among boys under the age of 16 in the United States with a correlation coefficient (R) of 0.446 and weighted average of 14.4%. Similarly, the statistical analysis conducted on geographies consisting of 263,748,099 people shows a significant positive correlation between the proportion of Serbians and poverty level among boys under the age of 16 in the United States with a correlation coefficient (R) of 0.671 and weighted average of 15.1%, a difference of 4.8%.
Child Poverty Among Boys Under 16 Correlation Summary
| Measurement | Immigrants from Czechoslovakia | Serbian |
| Minimum | 2.1% | 3.7% |
| Maximum | 48.2% | 100.0% |
| Range | 46.2% | 96.3% |
| Mean | 17.7% | 19.9% |
| Median | 14.4% | 14.5% |
| Interquartile 25% (IQ1) | 10.3% | 11.8% |
| Interquartile 75% (IQ3) | 21.9% | 19.6% |
| Interquartile Range (IQR) | 11.6% | 7.9% |
| Standard Deviation (Sample) | 10.6% | 17.9% |
| Standard Deviation (Population) | 10.5% | 17.6% |
Similar Demographics by Child Poverty Among Boys Under 16
Demographics Similar to Immigrants from Czechoslovakia by Child Poverty Among Boys Under 16
In terms of child poverty among boys under 16, the demographic groups most similar to Immigrants from Czechoslovakia are Immigrants from Sweden (14.4%, a difference of 0.020%), Immigrants from Belgium (14.4%, a difference of 0.020%), Polish (14.4%, a difference of 0.10%), Scandinavian (14.4%, a difference of 0.14%), and Immigrants from Pakistan (14.3%, a difference of 0.20%).
| Demographics | Rating | Rank | Child Poverty Among Boys Under 16 |
| Laotians | 99.0 /100 | #52 | Exceptional 14.3% |
| Immigrants | Philippines | 99.0 /100 | #53 | Exceptional 14.3% |
| Immigrants | Serbia | 99.0 /100 | #54 | Exceptional 14.3% |
| Immigrants | Pakistan | 99.0 /100 | #55 | Exceptional 14.3% |
| Zimbabweans | 99.0 /100 | #56 | Exceptional 14.3% |
| Poles | 98.9 /100 | #57 | Exceptional 14.4% |
| Immigrants | Sweden | 98.9 /100 | #58 | Exceptional 14.4% |
| Immigrants | Czechoslovakia | 98.9 /100 | #59 | Exceptional 14.4% |
| Immigrants | Belgium | 98.9 /100 | #60 | Exceptional 14.4% |
| Scandinavians | 98.8 /100 | #61 | Exceptional 14.4% |
| Immigrants | Israel | 98.7 /100 | #62 | Exceptional 14.4% |
| Cambodians | 98.5 /100 | #63 | Exceptional 14.5% |
| Immigrants | Romania | 98.5 /100 | #64 | Exceptional 14.5% |
| Soviet Union | 98.5 /100 | #65 | Exceptional 14.5% |
| Immigrants | Bulgaria | 98.5 /100 | #66 | Exceptional 14.5% |
Demographics Similar to Serbians by Child Poverty Among Boys Under 16
In terms of child poverty among boys under 16, the demographic groups most similar to Serbians are Jordanian (15.1%, a difference of 0.11%), Dutch (15.0%, a difference of 0.12%), Immigrants from Switzerland (15.0%, a difference of 0.13%), Immigrants from Denmark (15.0%, a difference of 0.23%), and Romanian (15.0%, a difference of 0.27%).
| Demographics | Rating | Rank | Child Poverty Among Boys Under 16 |
| Immigrants | France | 96.1 /100 | #99 | Exceptional 15.0% |
| Chileans | 95.8 /100 | #100 | Exceptional 15.0% |
| Immigrants | Belarus | 95.7 /100 | #101 | Exceptional 15.0% |
| Romanians | 95.6 /100 | #102 | Exceptional 15.0% |
| Immigrants | Denmark | 95.6 /100 | #103 | Exceptional 15.0% |
| Immigrants | Switzerland | 95.4 /100 | #104 | Exceptional 15.0% |
| Dutch | 95.4 /100 | #105 | Exceptional 15.0% |
| Serbians | 95.2 /100 | #106 | Exceptional 15.1% |
| Jordanians | 95.1 /100 | #107 | Exceptional 15.1% |
| Immigrants | England | 94.8 /100 | #108 | Exceptional 15.1% |
| Pakistanis | 94.7 /100 | #109 | Exceptional 15.1% |
| English | 94.3 /100 | #110 | Exceptional 15.1% |
| Immigrants | Zimbabwe | 94.2 /100 | #111 | Exceptional 15.2% |
| Basques | 93.8 /100 | #112 | Exceptional 15.2% |
| Irish | 93.8 /100 | #113 | Exceptional 15.2% |