Immigrants from Caribbean vs Serbian Child Poverty Among Boys Under 16
COMPARE
Immigrants from Caribbean
Serbian
Child Poverty Among Boys Under 16
Child Poverty Among Boys Under 16 Comparison
Immigrants from Caribbean
Serbians
21.0%
CHILD POVERTY AMONG BOYS UNDER 16
0.0/ 100
METRIC RATING
299th/ 347
METRIC RANK
15.1%
CHILD POVERTY AMONG BOYS UNDER 16
95.2/ 100
METRIC RATING
106th/ 347
METRIC RANK
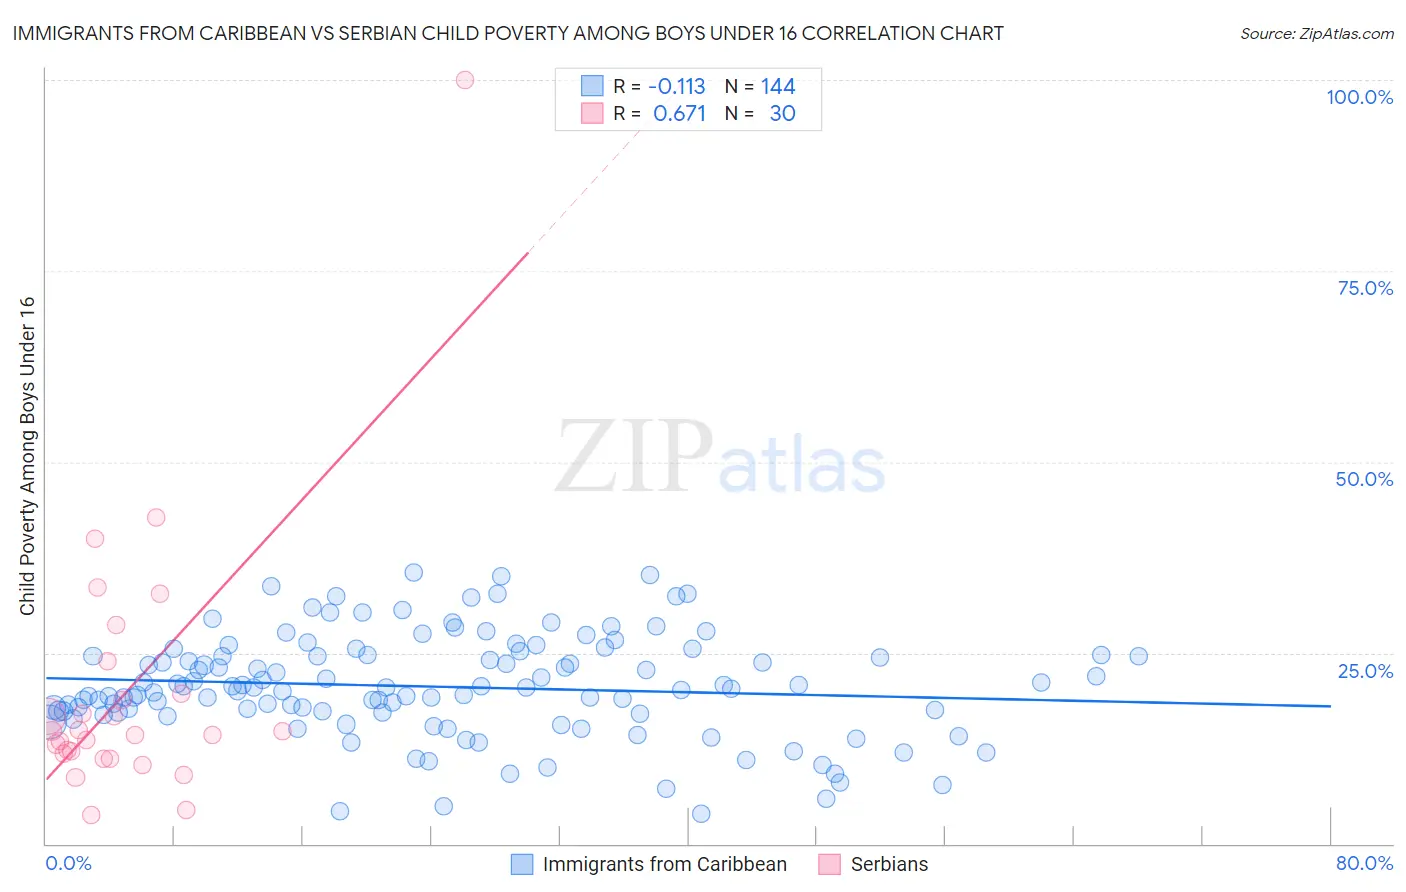
Immigrants from Caribbean vs Serbian Child Poverty Among Boys Under 16 Correlation Chart
The statistical analysis conducted on geographies consisting of 441,095,382 people shows a poor negative correlation between the proportion of Immigrants from Caribbean and poverty level among boys under the age of 16 in the United States with a correlation coefficient (R) of -0.113 and weighted average of 21.0%. Similarly, the statistical analysis conducted on geographies consisting of 263,748,099 people shows a significant positive correlation between the proportion of Serbians and poverty level among boys under the age of 16 in the United States with a correlation coefficient (R) of 0.671 and weighted average of 15.1%, a difference of 39.6%.
Child Poverty Among Boys Under 16 Correlation Summary
| Measurement | Immigrants from Caribbean | Serbian |
| Minimum | 3.9% | 3.7% |
| Maximum | 35.5% | 100.0% |
| Range | 31.6% | 96.3% |
| Mean | 20.6% | 19.9% |
| Median | 20.4% | 14.5% |
| Interquartile 25% (IQ1) | 17.2% | 11.8% |
| Interquartile 75% (IQ3) | 24.6% | 19.6% |
| Interquartile Range (IQR) | 7.4% | 7.9% |
| Standard Deviation (Sample) | 6.6% | 17.9% |
| Standard Deviation (Population) | 6.6% | 17.6% |
Similar Demographics by Child Poverty Among Boys Under 16
Demographics Similar to Immigrants from Caribbean by Child Poverty Among Boys Under 16
In terms of child poverty among boys under 16, the demographic groups most similar to Immigrants from Caribbean are Haitian (21.0%, a difference of 0.050%), Chippewa (21.0%, a difference of 0.27%), Hispanic or Latino (20.9%, a difference of 0.53%), Guatemalan (21.1%, a difference of 0.59%), and Somali (21.1%, a difference of 0.59%).
| Demographics | Rating | Rank | Child Poverty Among Boys Under 16 |
| Yaqui | 0.0 /100 | #292 | Tragic 20.7% |
| Immigrants | Senegal | 0.0 /100 | #293 | Tragic 20.7% |
| Immigrants | Bahamas | 0.0 /100 | #294 | Tragic 20.7% |
| Mexicans | 0.0 /100 | #295 | Tragic 20.7% |
| Indonesians | 0.0 /100 | #296 | Tragic 20.8% |
| Hispanics or Latinos | 0.0 /100 | #297 | Tragic 20.9% |
| Chippewa | 0.0 /100 | #298 | Tragic 21.0% |
| Immigrants | Caribbean | 0.0 /100 | #299 | Tragic 21.0% |
| Haitians | 0.0 /100 | #300 | Tragic 21.0% |
| Guatemalans | 0.0 /100 | #301 | Tragic 21.1% |
| Somalis | 0.0 /100 | #302 | Tragic 21.1% |
| Immigrants | Haiti | 0.0 /100 | #303 | Tragic 21.3% |
| Immigrants | Central America | 0.0 /100 | #304 | Tragic 21.3% |
| Kiowa | 0.0 /100 | #305 | Tragic 21.3% |
| Immigrants | Grenada | 0.0 /100 | #306 | Tragic 21.3% |
Demographics Similar to Serbians by Child Poverty Among Boys Under 16
In terms of child poverty among boys under 16, the demographic groups most similar to Serbians are Jordanian (15.1%, a difference of 0.11%), Dutch (15.0%, a difference of 0.12%), Immigrants from Switzerland (15.0%, a difference of 0.13%), Immigrants from Denmark (15.0%, a difference of 0.23%), and Romanian (15.0%, a difference of 0.27%).
| Demographics | Rating | Rank | Child Poverty Among Boys Under 16 |
| Immigrants | France | 96.1 /100 | #99 | Exceptional 15.0% |
| Chileans | 95.8 /100 | #100 | Exceptional 15.0% |
| Immigrants | Belarus | 95.7 /100 | #101 | Exceptional 15.0% |
| Romanians | 95.6 /100 | #102 | Exceptional 15.0% |
| Immigrants | Denmark | 95.6 /100 | #103 | Exceptional 15.0% |
| Immigrants | Switzerland | 95.4 /100 | #104 | Exceptional 15.0% |
| Dutch | 95.4 /100 | #105 | Exceptional 15.0% |
| Serbians | 95.2 /100 | #106 | Exceptional 15.1% |
| Jordanians | 95.1 /100 | #107 | Exceptional 15.1% |
| Immigrants | England | 94.8 /100 | #108 | Exceptional 15.1% |
| Pakistanis | 94.7 /100 | #109 | Exceptional 15.1% |
| English | 94.3 /100 | #110 | Exceptional 15.1% |
| Immigrants | Zimbabwe | 94.2 /100 | #111 | Exceptional 15.2% |
| Basques | 93.8 /100 | #112 | Exceptional 15.2% |
| Irish | 93.8 /100 | #113 | Exceptional 15.2% |