Immigrants from Czechoslovakia vs Hopi Child Poverty Among Boys Under 16
COMPARE
Immigrants from Czechoslovakia
Hopi
Child Poverty Among Boys Under 16
Child Poverty Among Boys Under 16 Comparison
Immigrants from Czechoslovakia
Hopi
14.4%
CHILD POVERTY AMONG BOYS UNDER 16
98.9/ 100
METRIC RATING
59th/ 347
METRIC RANK
25.9%
CHILD POVERTY AMONG BOYS UNDER 16
0.0/ 100
METRIC RATING
338th/ 347
METRIC RANK
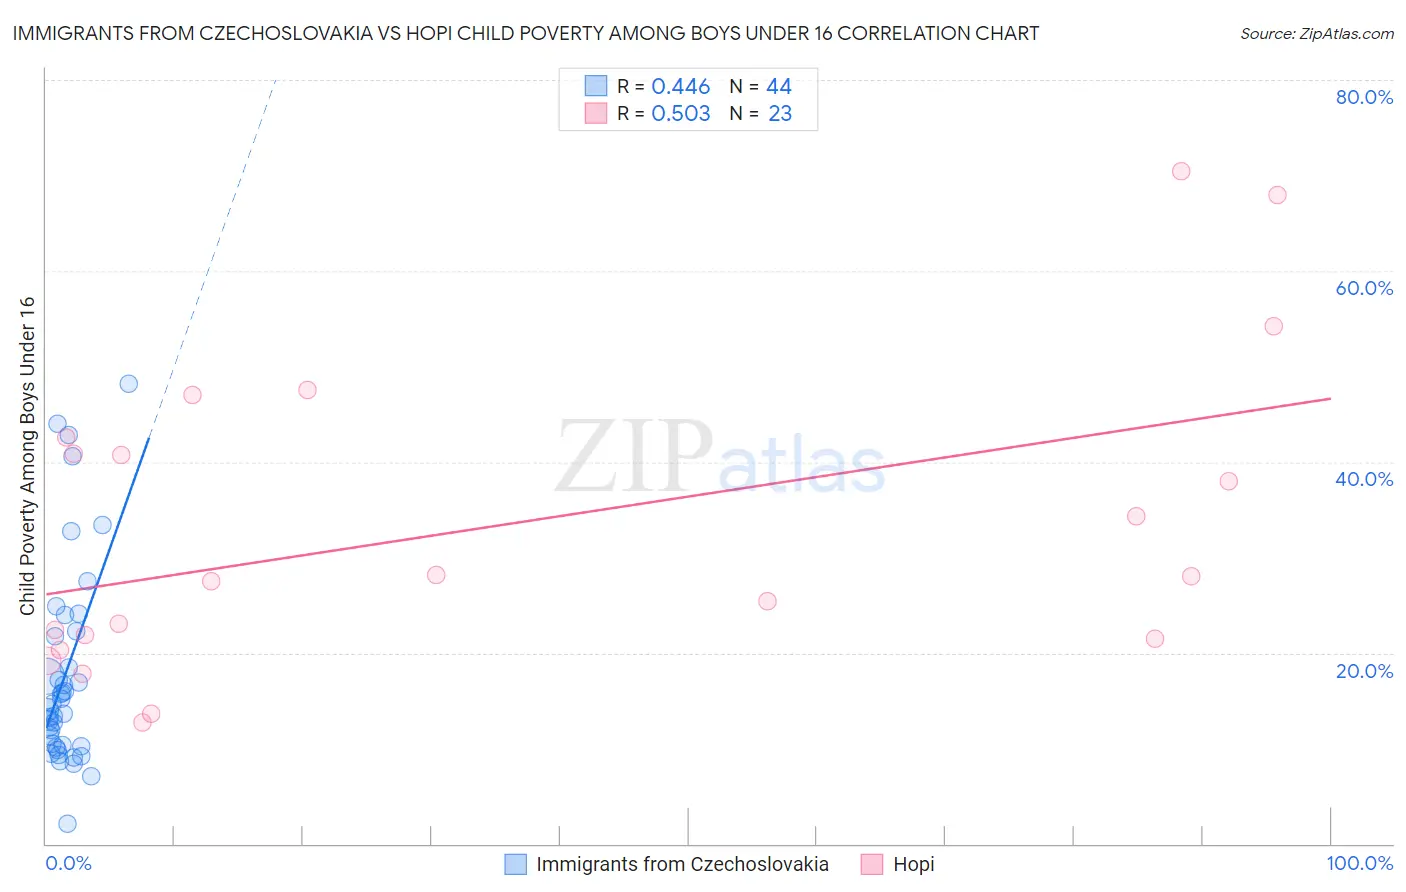
Immigrants from Czechoslovakia vs Hopi Child Poverty Among Boys Under 16 Correlation Chart
The statistical analysis conducted on geographies consisting of 192,998,028 people shows a moderate positive correlation between the proportion of Immigrants from Czechoslovakia and poverty level among boys under the age of 16 in the United States with a correlation coefficient (R) of 0.446 and weighted average of 14.4%. Similarly, the statistical analysis conducted on geographies consisting of 74,636,845 people shows a substantial positive correlation between the proportion of Hopi and poverty level among boys under the age of 16 in the United States with a correlation coefficient (R) of 0.503 and weighted average of 25.9%, a difference of 80.5%.
Child Poverty Among Boys Under 16 Correlation Summary
| Measurement | Immigrants from Czechoslovakia | Hopi |
| Minimum | 2.1% | 12.7% |
| Maximum | 48.2% | 70.4% |
| Range | 46.2% | 57.7% |
| Mean | 17.7% | 33.3% |
| Median | 14.4% | 28.1% |
| Interquartile 25% (IQ1) | 10.3% | 21.5% |
| Interquartile 75% (IQ3) | 21.9% | 42.6% |
| Interquartile Range (IQR) | 11.6% | 21.1% |
| Standard Deviation (Sample) | 10.6% | 16.1% |
| Standard Deviation (Population) | 10.5% | 15.7% |
Similar Demographics by Child Poverty Among Boys Under 16
Demographics Similar to Immigrants from Czechoslovakia by Child Poverty Among Boys Under 16
In terms of child poverty among boys under 16, the demographic groups most similar to Immigrants from Czechoslovakia are Immigrants from Sweden (14.4%, a difference of 0.020%), Immigrants from Belgium (14.4%, a difference of 0.020%), Polish (14.4%, a difference of 0.10%), Scandinavian (14.4%, a difference of 0.14%), and Immigrants from Pakistan (14.3%, a difference of 0.20%).
| Demographics | Rating | Rank | Child Poverty Among Boys Under 16 |
| Laotians | 99.0 /100 | #52 | Exceptional 14.3% |
| Immigrants | Philippines | 99.0 /100 | #53 | Exceptional 14.3% |
| Immigrants | Serbia | 99.0 /100 | #54 | Exceptional 14.3% |
| Immigrants | Pakistan | 99.0 /100 | #55 | Exceptional 14.3% |
| Zimbabweans | 99.0 /100 | #56 | Exceptional 14.3% |
| Poles | 98.9 /100 | #57 | Exceptional 14.4% |
| Immigrants | Sweden | 98.9 /100 | #58 | Exceptional 14.4% |
| Immigrants | Czechoslovakia | 98.9 /100 | #59 | Exceptional 14.4% |
| Immigrants | Belgium | 98.9 /100 | #60 | Exceptional 14.4% |
| Scandinavians | 98.8 /100 | #61 | Exceptional 14.4% |
| Immigrants | Israel | 98.7 /100 | #62 | Exceptional 14.4% |
| Cambodians | 98.5 /100 | #63 | Exceptional 14.5% |
| Immigrants | Romania | 98.5 /100 | #64 | Exceptional 14.5% |
| Soviet Union | 98.5 /100 | #65 | Exceptional 14.5% |
| Immigrants | Bulgaria | 98.5 /100 | #66 | Exceptional 14.5% |
Demographics Similar to Hopi by Child Poverty Among Boys Under 16
In terms of child poverty among boys under 16, the demographic groups most similar to Hopi are Cheyenne (25.8%, a difference of 0.51%), Houma (26.2%, a difference of 1.0%), Crow (26.3%, a difference of 1.2%), Sioux (25.3%, a difference of 2.5%), and Yup'ik (24.7%, a difference of 4.9%).
| Demographics | Rating | Rank | Child Poverty Among Boys Under 16 |
| Dominicans | 0.0 /100 | #331 | Tragic 24.2% |
| Immigrants | Dominican Republic | 0.0 /100 | #332 | Tragic 24.3% |
| Apache | 0.0 /100 | #333 | Tragic 24.5% |
| Blacks/African Americans | 0.0 /100 | #334 | Tragic 24.5% |
| Yup'ik | 0.0 /100 | #335 | Tragic 24.7% |
| Sioux | 0.0 /100 | #336 | Tragic 25.3% |
| Cheyenne | 0.0 /100 | #337 | Tragic 25.8% |
| Hopi | 0.0 /100 | #338 | Tragic 25.9% |
| Houma | 0.0 /100 | #339 | Tragic 26.2% |
| Crow | 0.0 /100 | #340 | Tragic 26.3% |
| Immigrants | Yemen | 0.0 /100 | #341 | Tragic 28.9% |
| Pima | 0.0 /100 | #342 | Tragic 29.7% |
| Navajo | 0.0 /100 | #343 | Tragic 30.3% |
| Yuman | 0.0 /100 | #344 | Tragic 30.6% |
| Tohono O'odham | 0.0 /100 | #345 | Tragic 31.6% |