Immigrants from Czechoslovakia vs Immigrants from Canada In Labor Force | Age 35-44
COMPARE
Immigrants from Czechoslovakia
Immigrants from Canada
In Labor Force | Age 35-44
In Labor Force | Age 35-44 Comparison
Immigrants from Czechoslovakia
Immigrants from Canada
84.8%
IN LABOR FORCE | AGE 35-44
95.9/ 100
METRIC RATING
100th/ 347
METRIC RANK
84.2%
IN LABOR FORCE | AGE 35-44
19.6/ 100
METRIC RATING
205th/ 347
METRIC RANK
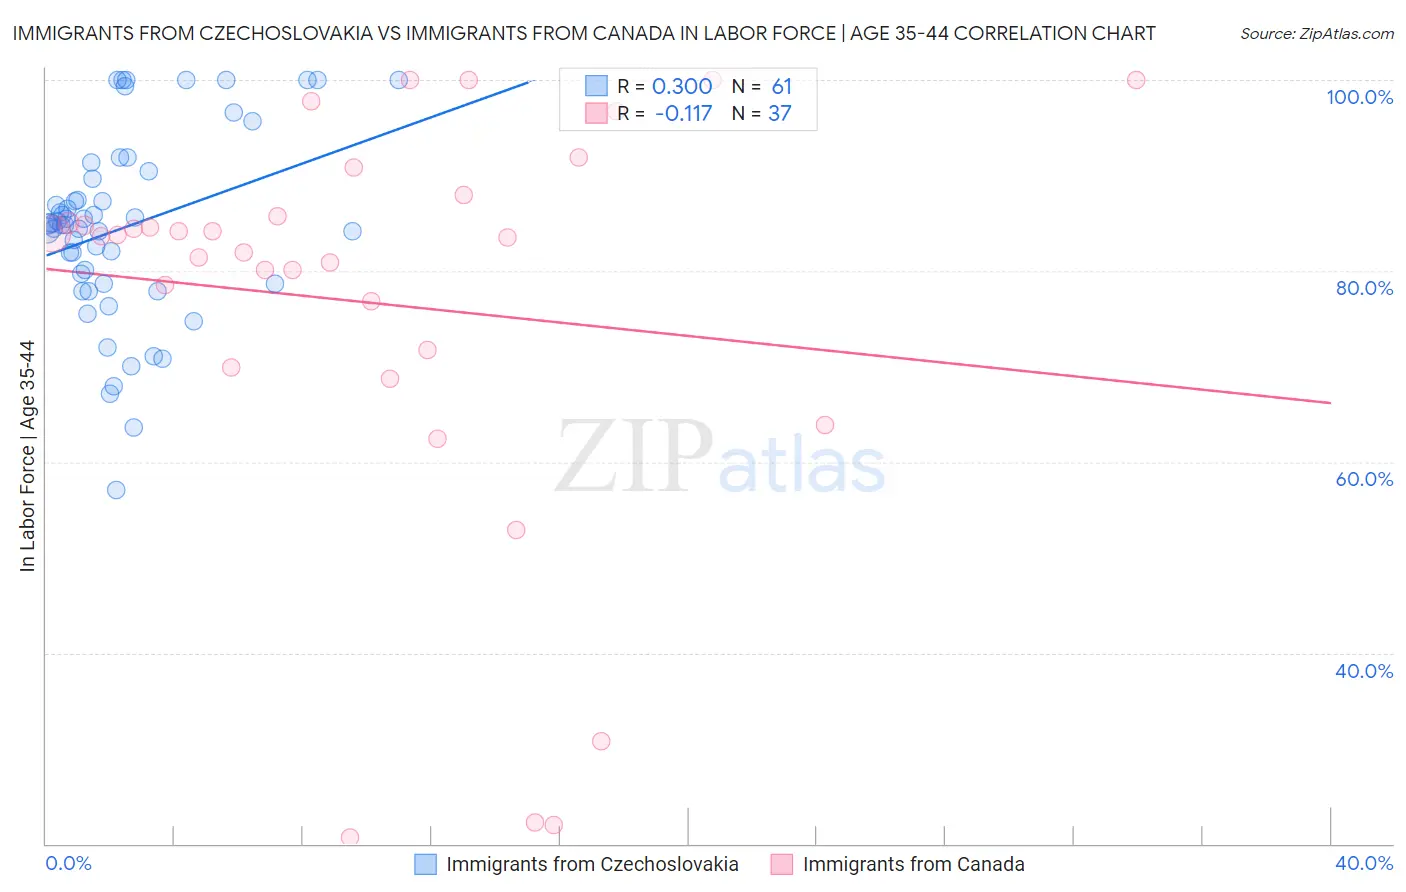
Immigrants from Czechoslovakia vs Immigrants from Canada In Labor Force | Age 35-44 Correlation Chart
The statistical analysis conducted on geographies consisting of 195,439,739 people shows a mild positive correlation between the proportion of Immigrants from Czechoslovakia and labor force participation rate among population between the ages 35 and 44 in the United States with a correlation coefficient (R) of 0.300 and weighted average of 84.8%. Similarly, the statistical analysis conducted on geographies consisting of 459,143,977 people shows a poor negative correlation between the proportion of Immigrants from Canada and labor force participation rate among population between the ages 35 and 44 in the United States with a correlation coefficient (R) of -0.117 and weighted average of 84.2%, a difference of 0.74%.
In Labor Force | Age 35-44 Correlation Summary
| Measurement | Immigrants from Czechoslovakia | Immigrants from Canada |
| Minimum | 57.1% | 20.7% |
| Maximum | 100.0% | 100.0% |
| Range | 42.9% | 79.3% |
| Mean | 84.5% | 76.7% |
| Median | 84.9% | 83.6% |
| Interquartile 25% (IQ1) | 78.6% | 70.8% |
| Interquartile 75% (IQ3) | 90.1% | 86.8% |
| Interquartile Range (IQR) | 11.5% | 16.0% |
| Standard Deviation (Sample) | 9.7% | 21.5% |
| Standard Deviation (Population) | 9.7% | 21.2% |
Similar Demographics by In Labor Force | Age 35-44
Demographics Similar to Immigrants from Czechoslovakia by In Labor Force | Age 35-44
In terms of in labor force | age 35-44, the demographic groups most similar to Immigrants from Czechoslovakia are Haitian (84.8%, a difference of 0.0%), Indian (Asian) (84.8%, a difference of 0.010%), Immigrants from Australia (84.8%, a difference of 0.010%), Immigrants from Southern Europe (84.8%, a difference of 0.020%), and Immigrants from Belarus (84.8%, a difference of 0.020%).
| Demographics | Rating | Rank | In Labor Force | Age 35-44 |
| Immigrants | Northern Africa | 97.1 /100 | #93 | Exceptional 84.8% |
| Mongolians | 96.8 /100 | #94 | Exceptional 84.8% |
| Immigrants | Kuwait | 96.7 /100 | #95 | Exceptional 84.8% |
| Cubans | 96.6 /100 | #96 | Exceptional 84.8% |
| Egyptians | 96.6 /100 | #97 | Exceptional 84.8% |
| Indians (Asian) | 96.1 /100 | #98 | Exceptional 84.8% |
| Haitians | 96.0 /100 | #99 | Exceptional 84.8% |
| Immigrants | Czechoslovakia | 95.9 /100 | #100 | Exceptional 84.8% |
| Immigrants | Australia | 95.5 /100 | #101 | Exceptional 84.8% |
| Immigrants | Southern Europe | 95.3 /100 | #102 | Exceptional 84.8% |
| Immigrants | Belarus | 95.3 /100 | #103 | Exceptional 84.8% |
| Immigrants | Sweden | 95.2 /100 | #104 | Exceptional 84.8% |
| South Americans | 95.0 /100 | #105 | Exceptional 84.8% |
| Immigrants | Bahamas | 94.8 /100 | #106 | Exceptional 84.8% |
| Immigrants | Romania | 94.7 /100 | #107 | Exceptional 84.8% |
Demographics Similar to Immigrants from Canada by In Labor Force | Age 35-44
In terms of in labor force | age 35-44, the demographic groups most similar to Immigrants from Canada are Canadian (84.2%, a difference of 0.0%), Immigrants from Costa Rica (84.2%, a difference of 0.0%), Laotian (84.2%, a difference of 0.010%), Immigrants from North America (84.2%, a difference of 0.020%), and Swiss (84.2%, a difference of 0.020%).
| Demographics | Rating | Rank | In Labor Force | Age 35-44 |
| Ecuadorians | 24.0 /100 | #198 | Fair 84.2% |
| Syrians | 23.2 /100 | #199 | Fair 84.2% |
| Moroccans | 23.2 /100 | #200 | Fair 84.2% |
| British | 23.0 /100 | #201 | Fair 84.2% |
| Immigrants | Uzbekistan | 22.8 /100 | #202 | Fair 84.2% |
| Immigrants | South Eastern Asia | 22.4 /100 | #203 | Fair 84.2% |
| Canadians | 19.9 /100 | #204 | Poor 84.2% |
| Immigrants | Canada | 19.6 /100 | #205 | Poor 84.2% |
| Immigrants | Costa Rica | 19.5 /100 | #206 | Poor 84.2% |
| Laotians | 19.0 /100 | #207 | Poor 84.2% |
| Immigrants | North America | 18.1 /100 | #208 | Poor 84.2% |
| Swiss | 17.4 /100 | #209 | Poor 84.2% |
| New Zealanders | 16.2 /100 | #210 | Poor 84.1% |
| Immigrants | Ecuador | 15.2 /100 | #211 | Poor 84.1% |
| Israelis | 14.0 /100 | #212 | Poor 84.1% |