Immigrants from Czechoslovakia vs Creek Child Poverty Under the Age of 5
COMPARE
Immigrants from Czechoslovakia
Creek
Child Poverty Under the Age of 5
Child Poverty Under the Age of 5 Comparison
Immigrants from Czechoslovakia
Creek
14.8%
CHILD POVERTY UNDER THE AGE OF 5
99.6/ 100
METRIC RATING
48th/ 347
METRIC RANK
24.2%
CHILD POVERTY UNDER THE AGE OF 5
0.0/ 100
METRIC RATING
330th/ 347
METRIC RANK
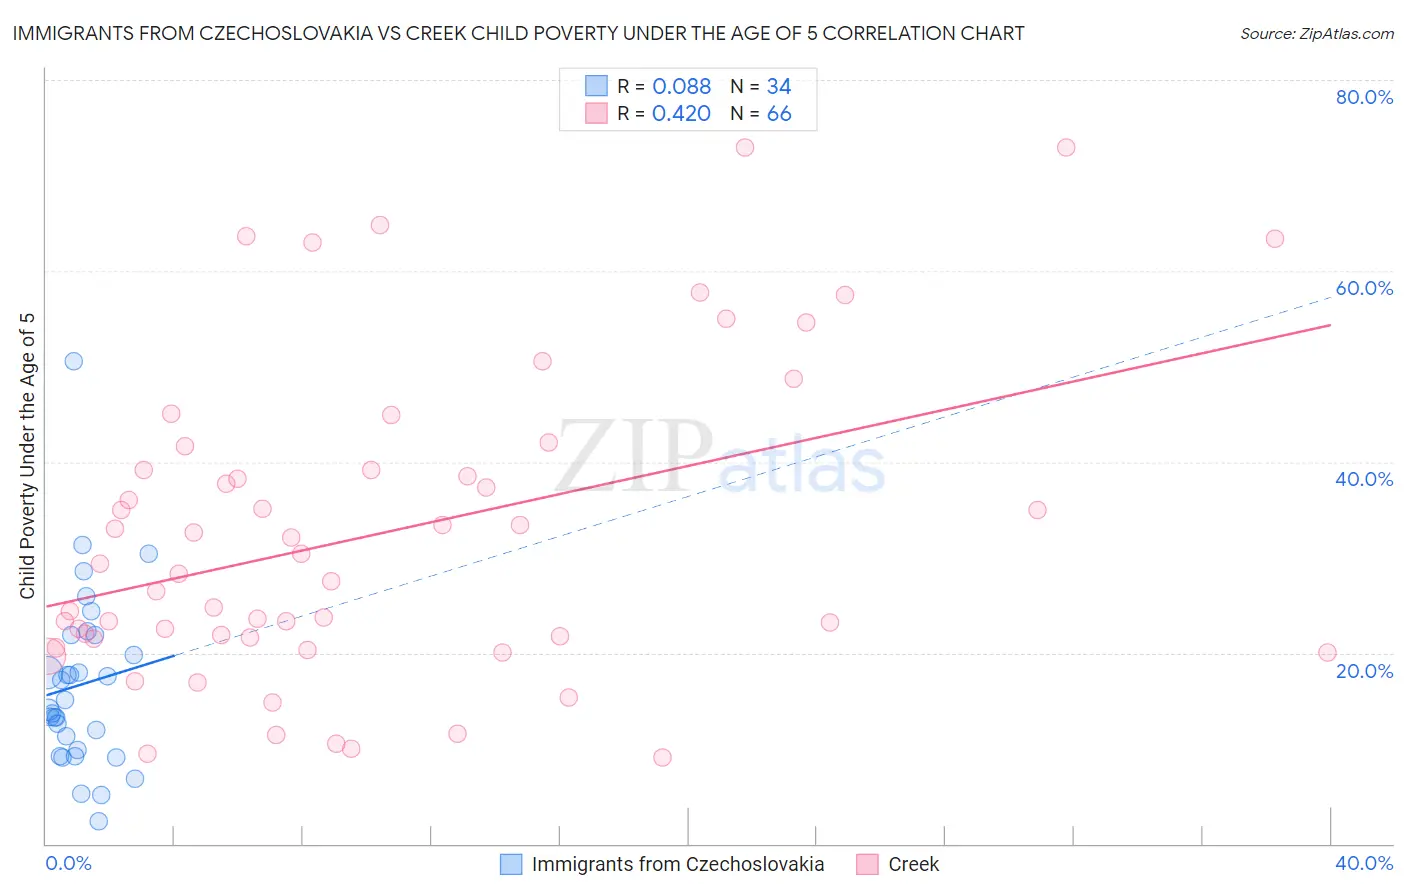
Immigrants from Czechoslovakia vs Creek Child Poverty Under the Age of 5 Correlation Chart
The statistical analysis conducted on geographies consisting of 189,024,563 people shows a slight positive correlation between the proportion of Immigrants from Czechoslovakia and poverty level among children under the age of 5 in the United States with a correlation coefficient (R) of 0.088 and weighted average of 14.8%. Similarly, the statistical analysis conducted on geographies consisting of 175,779,647 people shows a moderate positive correlation between the proportion of Creek and poverty level among children under the age of 5 in the United States with a correlation coefficient (R) of 0.420 and weighted average of 24.2%, a difference of 63.9%.
Child Poverty Under the Age of 5 Correlation Summary
| Measurement | Immigrants from Czechoslovakia | Creek |
| Minimum | 2.3% | 9.1% |
| Maximum | 50.5% | 73.0% |
| Range | 48.2% | 63.9% |
| Mean | 16.7% | 32.5% |
| Median | 14.5% | 28.8% |
| Interquartile 25% (IQ1) | 9.8% | 21.6% |
| Interquartile 75% (IQ3) | 21.8% | 39.1% |
| Interquartile Range (IQR) | 12.1% | 17.5% |
| Standard Deviation (Sample) | 9.4% | 16.2% |
| Standard Deviation (Population) | 9.2% | 16.1% |
Similar Demographics by Child Poverty Under the Age of 5
Demographics Similar to Immigrants from Czechoslovakia by Child Poverty Under the Age of 5
In terms of child poverty under the age of 5, the demographic groups most similar to Immigrants from Czechoslovakia are Russian (14.8%, a difference of 0.11%), Immigrants from Bulgaria (14.8%, a difference of 0.15%), Tsimshian (14.7%, a difference of 0.24%), Immigrants from Northern Europe (14.8%, a difference of 0.24%), and Estonian (14.8%, a difference of 0.29%).
| Demographics | Rating | Rank | Child Poverty Under the Age of 5 |
| Immigrants | Belarus | 99.7 /100 | #41 | Exceptional 14.7% |
| Soviet Union | 99.7 /100 | #42 | Exceptional 14.7% |
| Immigrants | Greece | 99.7 /100 | #43 | Exceptional 14.7% |
| Immigrants | Philippines | 99.7 /100 | #44 | Exceptional 14.7% |
| Laotians | 99.6 /100 | #45 | Exceptional 14.7% |
| Tsimshian | 99.6 /100 | #46 | Exceptional 14.7% |
| Russians | 99.6 /100 | #47 | Exceptional 14.8% |
| Immigrants | Czechoslovakia | 99.6 /100 | #48 | Exceptional 14.8% |
| Immigrants | Bulgaria | 99.6 /100 | #49 | Exceptional 14.8% |
| Immigrants | Northern Europe | 99.6 /100 | #50 | Exceptional 14.8% |
| Estonians | 99.6 /100 | #51 | Exceptional 14.8% |
| Immigrants | Serbia | 99.5 /100 | #52 | Exceptional 14.9% |
| Luxembourgers | 99.4 /100 | #53 | Exceptional 14.9% |
| Immigrants | Israel | 99.4 /100 | #54 | Exceptional 14.9% |
| Danes | 99.4 /100 | #55 | Exceptional 14.9% |
Demographics Similar to Creek by Child Poverty Under the Age of 5
In terms of child poverty under the age of 5, the demographic groups most similar to Creek are Cajun (24.1%, a difference of 0.44%), Immigrants from Dominican Republic (24.1%, a difference of 0.67%), Dominican (24.0%, a difference of 0.76%), Kiowa (24.5%, a difference of 1.0%), and Central American Indian (23.9%, a difference of 1.2%).
| Demographics | Rating | Rank | Child Poverty Under the Age of 5 |
| Pueblo | 0.0 /100 | #323 | Tragic 23.7% |
| Paiute | 0.0 /100 | #324 | Tragic 23.8% |
| Immigrants | Congo | 0.0 /100 | #325 | Tragic 23.9% |
| Central American Indians | 0.0 /100 | #326 | Tragic 23.9% |
| Dominicans | 0.0 /100 | #327 | Tragic 24.0% |
| Immigrants | Dominican Republic | 0.0 /100 | #328 | Tragic 24.1% |
| Cajuns | 0.0 /100 | #329 | Tragic 24.1% |
| Creek | 0.0 /100 | #330 | Tragic 24.2% |
| Kiowa | 0.0 /100 | #331 | Tragic 24.5% |
| Apache | 0.0 /100 | #332 | Tragic 25.0% |
| Natives/Alaskans | 0.0 /100 | #333 | Tragic 25.6% |
| Blacks/African Americans | 0.0 /100 | #334 | Tragic 25.7% |
| Colville | 0.0 /100 | #335 | Tragic 25.7% |
| Sioux | 0.0 /100 | #336 | Tragic 26.9% |
| Pima | 0.0 /100 | #337 | Tragic 27.4% |