Immigrants from Kazakhstan vs Immigrants from Haiti Child Poverty Under the Age of 16
COMPARE
Immigrants from Kazakhstan
Immigrants from Haiti
Child Poverty Under the Age of 16
Child Poverty Under the Age of 16 Comparison
Immigrants from Kazakhstan
Immigrants from Haiti
15.1%
CHILD POVERTY UNDER THE AGE OF 16
90.2/ 100
METRIC RATING
128th/ 347
METRIC RANK
20.9%
CHILD POVERTY UNDER THE AGE OF 16
0.0/ 100
METRIC RATING
299th/ 347
METRIC RANK
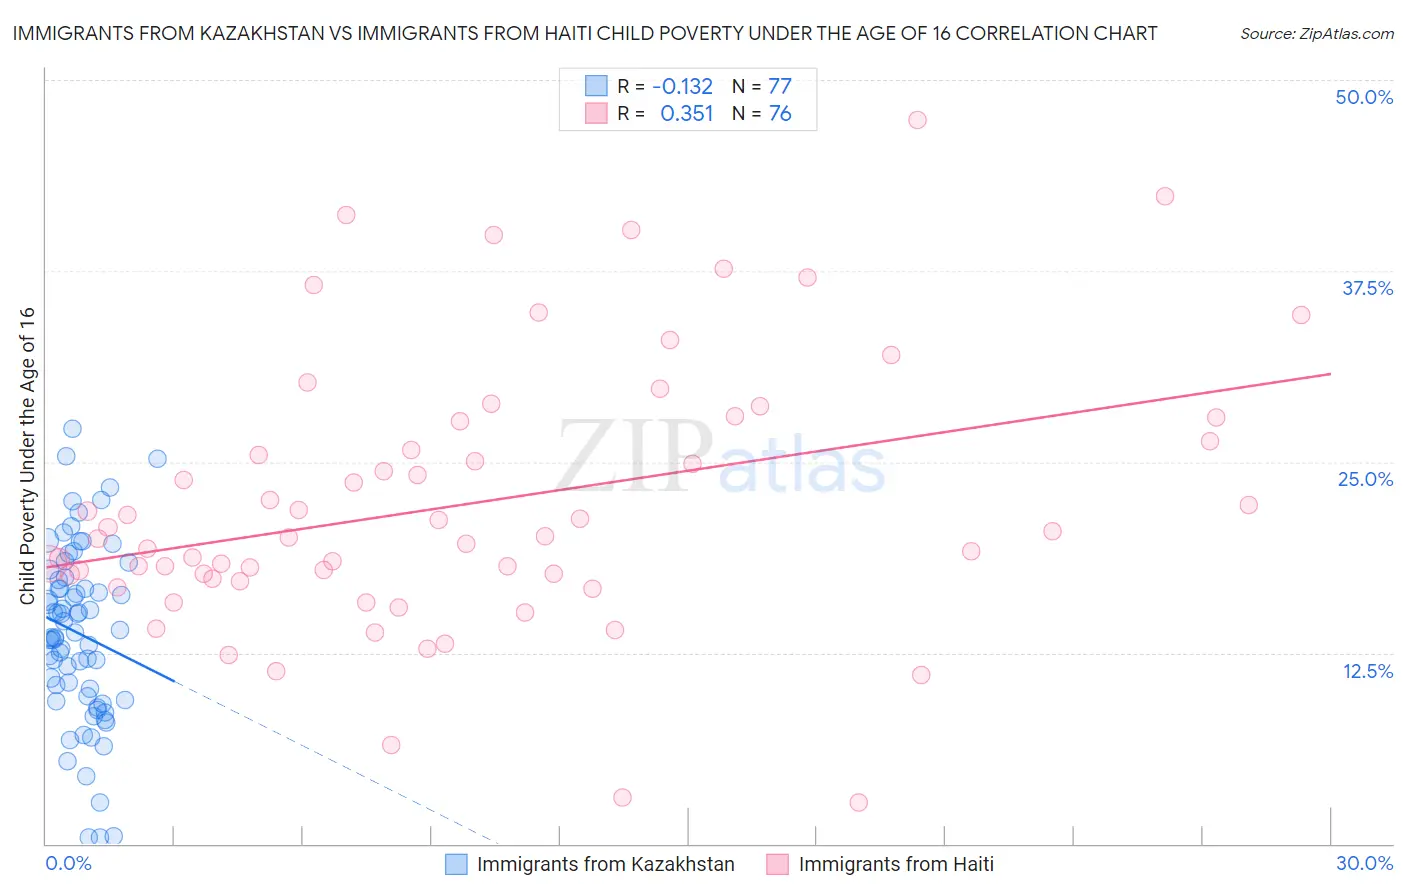
Immigrants from Kazakhstan vs Immigrants from Haiti Child Poverty Under the Age of 16 Correlation Chart
The statistical analysis conducted on geographies consisting of 123,992,242 people shows a poor negative correlation between the proportion of Immigrants from Kazakhstan and poverty level among children under the age of 16 in the United States with a correlation coefficient (R) of -0.132 and weighted average of 15.1%. Similarly, the statistical analysis conducted on geographies consisting of 224,047,921 people shows a mild positive correlation between the proportion of Immigrants from Haiti and poverty level among children under the age of 16 in the United States with a correlation coefficient (R) of 0.351 and weighted average of 20.9%, a difference of 37.9%.
Child Poverty Under the Age of 16 Correlation Summary
| Measurement | Immigrants from Kazakhstan | Immigrants from Haiti |
| Minimum | 0.43% | 2.7% |
| Maximum | 27.1% | 47.4% |
| Range | 26.7% | 44.6% |
| Mean | 13.8% | 22.3% |
| Median | 13.9% | 20.1% |
| Interquartile 25% (IQ1) | 9.5% | 17.5% |
| Interquartile 75% (IQ3) | 17.3% | 27.0% |
| Interquartile Range (IQR) | 7.8% | 9.5% |
| Standard Deviation (Sample) | 5.8% | 8.8% |
| Standard Deviation (Population) | 5.7% | 8.8% |
Similar Demographics by Child Poverty Under the Age of 16
Demographics Similar to Immigrants from Kazakhstan by Child Poverty Under the Age of 16
In terms of child poverty under the age of 16, the demographic groups most similar to Immigrants from Kazakhstan are Immigrants from Western Europe (15.1%, a difference of 0.060%), Portuguese (15.1%, a difference of 0.15%), Immigrants from Southern Europe (15.1%, a difference of 0.15%), Mongolian (15.2%, a difference of 0.25%), and Armenian (15.2%, a difference of 0.28%).
| Demographics | Rating | Rank | Child Poverty Under the Age of 16 |
| Immigrants | Zimbabwe | 92.1 /100 | #121 | Exceptional 15.0% |
| Pakistanis | 91.7 /100 | #122 | Exceptional 15.0% |
| Immigrants | Brazil | 91.1 /100 | #123 | Exceptional 15.1% |
| Czechoslovakians | 91.0 /100 | #124 | Exceptional 15.1% |
| Palestinians | 90.9 /100 | #125 | Exceptional 15.1% |
| Portuguese | 90.6 /100 | #126 | Exceptional 15.1% |
| Immigrants | Western Europe | 90.3 /100 | #127 | Exceptional 15.1% |
| Immigrants | Kazakhstan | 90.2 /100 | #128 | Exceptional 15.1% |
| Immigrants | Southern Europe | 89.7 /100 | #129 | Excellent 15.1% |
| Mongolians | 89.5 /100 | #130 | Excellent 15.2% |
| Armenians | 89.4 /100 | #131 | Excellent 15.2% |
| Canadians | 89.1 /100 | #132 | Excellent 15.2% |
| Immigrants | South Eastern Asia | 89.0 /100 | #133 | Excellent 15.2% |
| Native Hawaiians | 88.7 /100 | #134 | Excellent 15.2% |
| Albanians | 88.6 /100 | #135 | Excellent 15.2% |
Demographics Similar to Immigrants from Haiti by Child Poverty Under the Age of 16
In terms of child poverty under the age of 16, the demographic groups most similar to Immigrants from Haiti are Arapaho (20.8%, a difference of 0.30%), Hispanic or Latino (20.8%, a difference of 0.31%), Immigrants from Caribbean (20.8%, a difference of 0.43%), Indonesian (21.0%, a difference of 0.49%), and Immigrants from Grenada (21.0%, a difference of 0.54%).
| Demographics | Rating | Rank | Child Poverty Under the Age of 16 |
| Immigrants | Latin America | 0.0 /100 | #292 | Tragic 20.5% |
| Immigrants | Senegal | 0.0 /100 | #293 | Tragic 20.6% |
| Haitians | 0.0 /100 | #294 | Tragic 20.7% |
| Mexicans | 0.0 /100 | #295 | Tragic 20.7% |
| Immigrants | Caribbean | 0.0 /100 | #296 | Tragic 20.8% |
| Hispanics or Latinos | 0.0 /100 | #297 | Tragic 20.8% |
| Arapaho | 0.0 /100 | #298 | Tragic 20.8% |
| Immigrants | Haiti | 0.0 /100 | #299 | Tragic 20.9% |
| Indonesians | 0.0 /100 | #300 | Tragic 21.0% |
| Immigrants | Grenada | 0.0 /100 | #301 | Tragic 21.0% |
| Immigrants | Bahamas | 0.0 /100 | #302 | Tragic 21.0% |
| Choctaw | 0.0 /100 | #303 | Tragic 21.0% |
| Somalis | 0.0 /100 | #304 | Tragic 21.0% |
| Seminole | 0.0 /100 | #305 | Tragic 21.1% |
| Guatemalans | 0.0 /100 | #306 | Tragic 21.2% |