Immigrants from Cuba vs Immigrants from Guyana Kindergarten
COMPARE
Immigrants from Cuba
Immigrants from Guyana
Kindergarten
Kindergarten Comparison
Immigrants from Cuba
Immigrants from Guyana
97.1%
KINDERGARTEN
0.0/ 100
METRIC RATING
299th/ 347
METRIC RANK
96.8%
KINDERGARTEN
0.0/ 100
METRIC RATING
319th/ 347
METRIC RANK
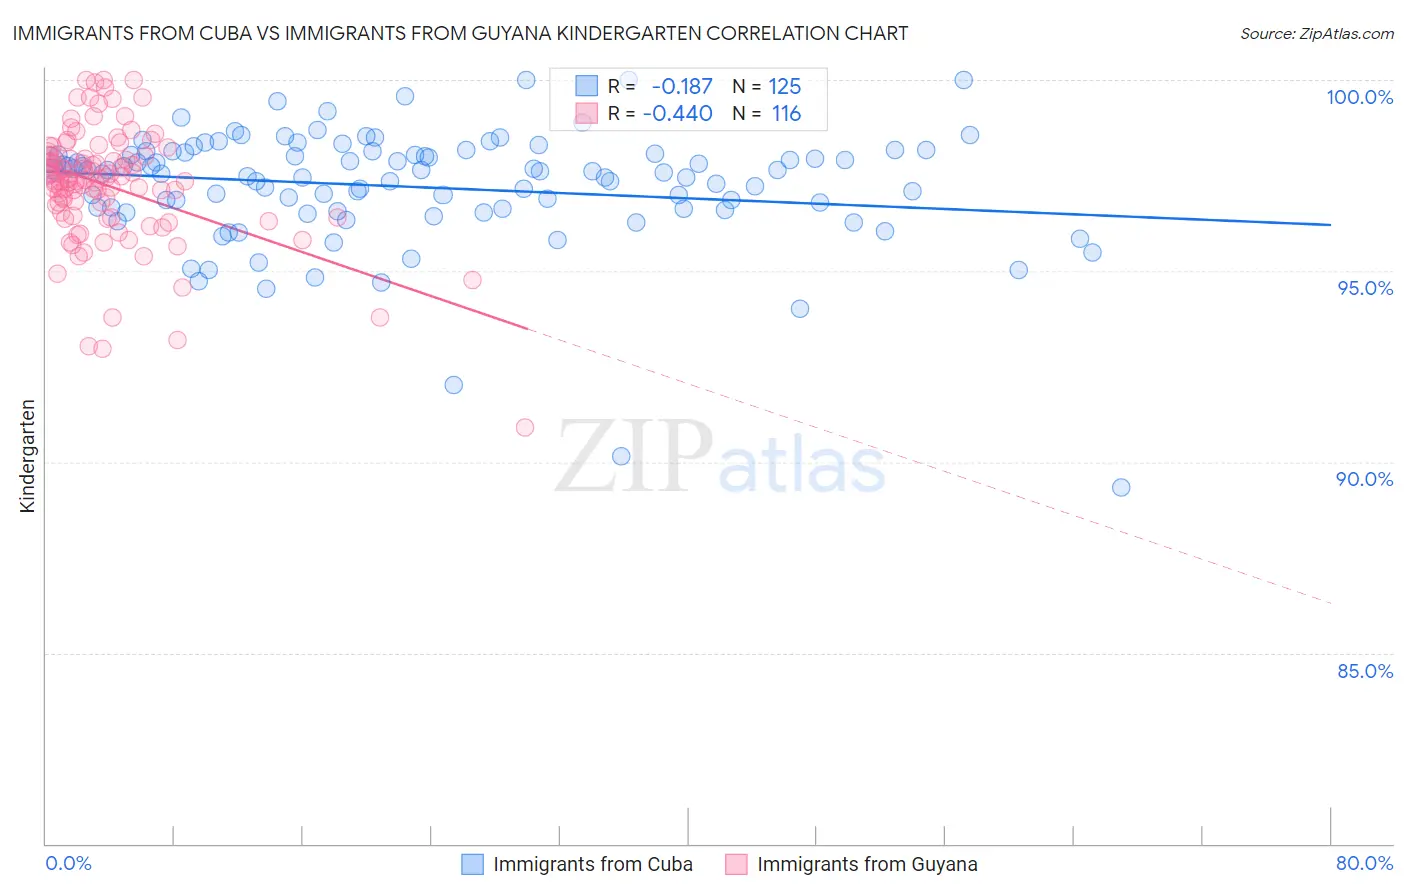
Immigrants from Cuba vs Immigrants from Guyana Kindergarten Correlation Chart
The statistical analysis conducted on geographies consisting of 326,028,159 people shows a poor negative correlation between the proportion of Immigrants from Cuba and percentage of population with at least kindergarten education in the United States with a correlation coefficient (R) of -0.187 and weighted average of 97.1%. Similarly, the statistical analysis conducted on geographies consisting of 183,746,342 people shows a moderate negative correlation between the proportion of Immigrants from Guyana and percentage of population with at least kindergarten education in the United States with a correlation coefficient (R) of -0.440 and weighted average of 96.8%, a difference of 0.30%.
Kindergarten Correlation Summary
| Measurement | Immigrants from Cuba | Immigrants from Guyana |
| Minimum | 89.3% | 90.9% |
| Maximum | 100.0% | 100.0% |
| Range | 10.7% | 9.1% |
| Mean | 97.2% | 97.2% |
| Median | 97.6% | 97.4% |
| Interquartile 25% (IQ1) | 96.6% | 96.4% |
| Interquartile 75% (IQ3) | 98.1% | 98.0% |
| Interquartile Range (IQR) | 1.5% | 1.6% |
| Standard Deviation (Sample) | 1.6% | 1.5% |
| Standard Deviation (Population) | 1.6% | 1.5% |
Demographics Similar to Immigrants from Cuba and Immigrants from Guyana by Kindergarten
In terms of kindergarten, the demographic groups most similar to Immigrants from Cuba are Haitian (97.1%, a difference of 0.010%), Immigrants from South Eastern Asia (97.1%, a difference of 0.030%), Immigrants from Caribbean (97.1%, a difference of 0.060%), Somali (97.0%, a difference of 0.090%), and Nicaraguan (97.0%, a difference of 0.10%). Similarly, the demographic groups most similar to Immigrants from Guyana are Immigrants from Laos (96.9%, a difference of 0.010%), Immigrants from Nicaragua (96.9%, a difference of 0.060%), Immigrants from Ecuador (96.9%, a difference of 0.060%), Immigrants from Belize (96.9%, a difference of 0.070%), and Honduran (96.9%, a difference of 0.080%).
| Demographics | Rating | Rank | Kindergarten |
| Immigrants | Cuba | 0.0 /100 | #299 | Tragic 97.1% |
| Haitians | 0.0 /100 | #300 | Tragic 97.1% |
| Immigrants | South Eastern Asia | 0.0 /100 | #301 | Tragic 97.1% |
| Immigrants | Caribbean | 0.0 /100 | #302 | Tragic 97.1% |
| Somalis | 0.0 /100 | #303 | Tragic 97.0% |
| Nicaraguans | 0.0 /100 | #304 | Tragic 97.0% |
| Ecuadorians | 0.0 /100 | #305 | Tragic 97.0% |
| Belizeans | 0.0 /100 | #306 | Tragic 97.0% |
| Hispanics or Latinos | 0.0 /100 | #307 | Tragic 97.0% |
| Immigrants | Somalia | 0.0 /100 | #308 | Tragic 97.0% |
| Immigrants | Haiti | 0.0 /100 | #309 | Tragic 97.0% |
| Immigrants | Azores | 0.0 /100 | #310 | Tragic 97.0% |
| Sri Lankans | 0.0 /100 | #311 | Tragic 97.0% |
| Guyanese | 0.0 /100 | #312 | Tragic 96.9% |
| Cape Verdeans | 0.0 /100 | #313 | Tragic 96.9% |
| Hondurans | 0.0 /100 | #314 | Tragic 96.9% |
| Immigrants | Belize | 0.0 /100 | #315 | Tragic 96.9% |
| Immigrants | Nicaragua | 0.0 /100 | #316 | Tragic 96.9% |
| Immigrants | Ecuador | 0.0 /100 | #317 | Tragic 96.9% |
| Immigrants | Laos | 0.0 /100 | #318 | Tragic 96.9% |
| Immigrants | Guyana | 0.0 /100 | #319 | Tragic 96.8% |