Immigrants from Cuba vs Immigrants from Dominican Republic Male Poverty
COMPARE
Immigrants from Cuba
Immigrants from Dominican Republic
Male Poverty
Male Poverty Comparison
Immigrants from Cuba
Immigrants from Dominican Republic
12.9%
MALE POVERTY
0.2/ 100
METRIC RATING
251st/ 347
METRIC RANK
16.2%
MALE POVERTY
0.0/ 100
METRIC RATING
330th/ 347
METRIC RANK
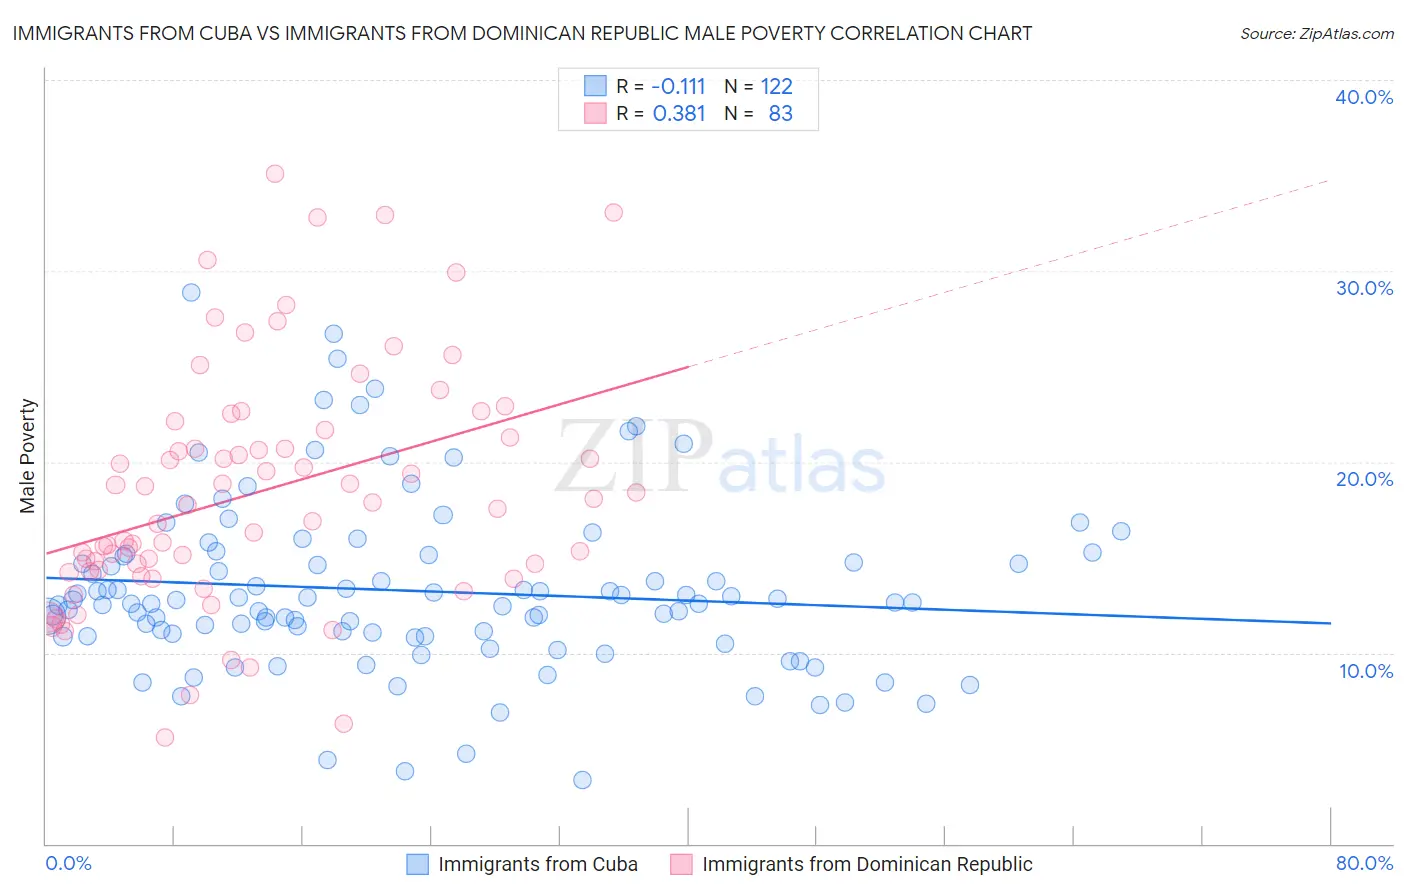
Immigrants from Cuba vs Immigrants from Dominican Republic Male Poverty Correlation Chart
The statistical analysis conducted on geographies consisting of 325,880,105 people shows a poor negative correlation between the proportion of Immigrants from Cuba and poverty level among males in the United States with a correlation coefficient (R) of -0.111 and weighted average of 12.9%. Similarly, the statistical analysis conducted on geographies consisting of 274,910,584 people shows a mild positive correlation between the proportion of Immigrants from Dominican Republic and poverty level among males in the United States with a correlation coefficient (R) of 0.381 and weighted average of 16.2%, a difference of 25.3%.
Male Poverty Correlation Summary
| Measurement | Immigrants from Cuba | Immigrants from Dominican Republic |
| Minimum | 3.3% | 5.5% |
| Maximum | 28.9% | 35.1% |
| Range | 25.5% | 29.5% |
| Mean | 13.2% | 18.4% |
| Median | 12.6% | 17.7% |
| Interquartile 25% (IQ1) | 10.9% | 14.2% |
| Interquartile 75% (IQ3) | 15.1% | 21.7% |
| Interquartile Range (IQR) | 4.2% | 7.5% |
| Standard Deviation (Sample) | 4.5% | 6.2% |
| Standard Deviation (Population) | 4.5% | 6.2% |
Similar Demographics by Male Poverty
Demographics Similar to Immigrants from Cuba by Male Poverty
In terms of male poverty, the demographic groups most similar to Immigrants from Cuba are Immigrants from Ecuador (12.9%, a difference of 0.030%), Immigrants from Ghana (12.9%, a difference of 0.080%), Immigrants from Nicaragua (12.9%, a difference of 0.10%), Potawatomi (12.9%, a difference of 0.11%), and Immigrants from Sudan (12.9%, a difference of 0.18%).
| Demographics | Rating | Rank | Male Poverty |
| Tsimshian | 0.3 /100 | #244 | Tragic 12.8% |
| Liberians | 0.3 /100 | #245 | Tragic 12.8% |
| Immigrants | El Salvador | 0.2 /100 | #246 | Tragic 12.8% |
| Immigrants | Western Africa | 0.2 /100 | #247 | Tragic 12.9% |
| Immigrants | Sudan | 0.2 /100 | #248 | Tragic 12.9% |
| Potawatomi | 0.2 /100 | #249 | Tragic 12.9% |
| Immigrants | Nicaragua | 0.2 /100 | #250 | Tragic 12.9% |
| Immigrants | Cuba | 0.2 /100 | #251 | Tragic 12.9% |
| Immigrants | Ecuador | 0.2 /100 | #252 | Tragic 12.9% |
| Immigrants | Ghana | 0.2 /100 | #253 | Tragic 12.9% |
| Mexican American Indians | 0.1 /100 | #254 | Tragic 13.0% |
| Immigrants | Liberia | 0.1 /100 | #255 | Tragic 13.0% |
| Immigrants | Burma/Myanmar | 0.1 /100 | #256 | Tragic 13.0% |
| Immigrants | Trinidad and Tobago | 0.1 /100 | #257 | Tragic 13.1% |
| Cape Verdeans | 0.1 /100 | #258 | Tragic 13.1% |
Demographics Similar to Immigrants from Dominican Republic by Male Poverty
In terms of male poverty, the demographic groups most similar to Immigrants from Dominican Republic are Ute (16.2%, a difference of 0.34%), Dominican (16.1%, a difference of 0.65%), Black/African American (15.8%, a difference of 2.4%), Paiute (15.8%, a difference of 2.4%), and Houma (16.7%, a difference of 3.3%).
| Demographics | Rating | Rank | Male Poverty |
| Colville | 0.0 /100 | #323 | Tragic 15.2% |
| Menominee | 0.0 /100 | #324 | Tragic 15.3% |
| Yakama | 0.0 /100 | #325 | Tragic 15.3% |
| Central American Indians | 0.0 /100 | #326 | Tragic 15.3% |
| Paiute | 0.0 /100 | #327 | Tragic 15.8% |
| Blacks/African Americans | 0.0 /100 | #328 | Tragic 15.8% |
| Dominicans | 0.0 /100 | #329 | Tragic 16.1% |
| Immigrants | Dominican Republic | 0.0 /100 | #330 | Tragic 16.2% |
| Ute | 0.0 /100 | #331 | Tragic 16.2% |
| Houma | 0.0 /100 | #332 | Tragic 16.7% |
| Natives/Alaskans | 0.0 /100 | #333 | Tragic 16.9% |
| Cheyenne | 0.0 /100 | #334 | Tragic 17.6% |
| Apache | 0.0 /100 | #335 | Tragic 17.7% |
| Pueblo | 0.0 /100 | #336 | Tragic 18.5% |
| Sioux | 0.0 /100 | #337 | Tragic 18.7% |