Immigrants from Croatia vs Immigrants from Colombia Child Poverty Among Girls Under 16
COMPARE
Immigrants from Croatia
Immigrants from Colombia
Child Poverty Among Girls Under 16
Child Poverty Among Girls Under 16 Comparison
Immigrants from Croatia
Immigrants from Colombia
15.1%
CHILD POVERTY AMONG GIRLS UNDER 16
94.6/ 100
METRIC RATING
110th/ 347
METRIC RANK
16.1%
CHILD POVERTY AMONG GIRLS UNDER 16
67.8/ 100
METRIC RATING
164th/ 347
METRIC RANK
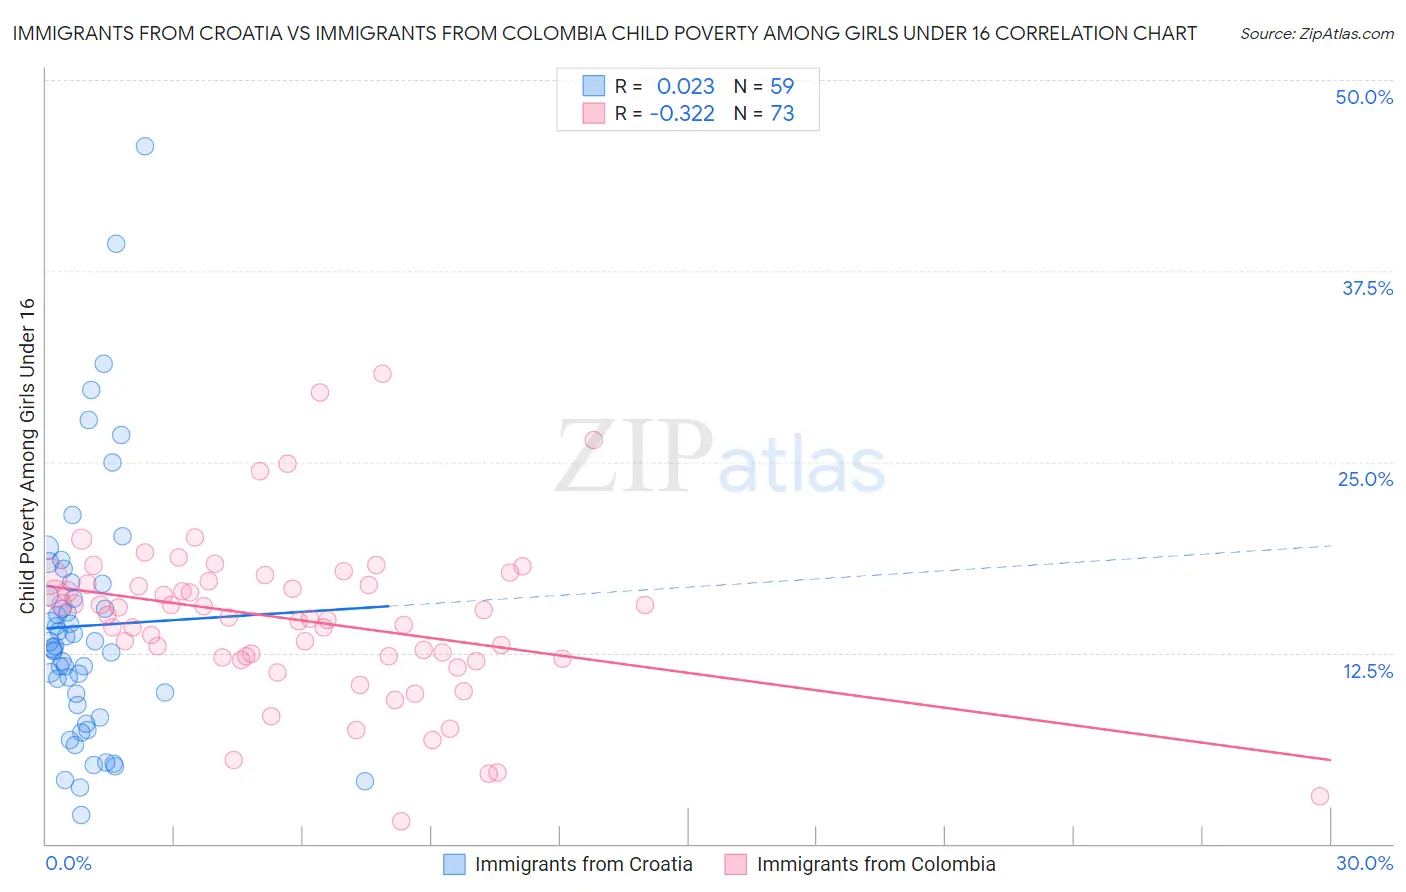
Immigrants from Croatia vs Immigrants from Colombia Child Poverty Among Girls Under 16 Correlation Chart
The statistical analysis conducted on geographies consisting of 131,350,096 people shows no correlation between the proportion of Immigrants from Croatia and poverty level among girls under the age of 16 in the United States with a correlation coefficient (R) of 0.023 and weighted average of 15.1%. Similarly, the statistical analysis conducted on geographies consisting of 372,546,241 people shows a mild negative correlation between the proportion of Immigrants from Colombia and poverty level among girls under the age of 16 in the United States with a correlation coefficient (R) of -0.322 and weighted average of 16.1%, a difference of 6.6%.
Child Poverty Among Girls Under 16 Correlation Summary
| Measurement | Immigrants from Croatia | Immigrants from Colombia |
| Minimum | 1.9% | 1.5% |
| Maximum | 45.7% | 30.8% |
| Range | 43.8% | 29.3% |
| Mean | 14.3% | 14.6% |
| Median | 13.0% | 14.9% |
| Interquartile 25% (IQ1) | 9.1% | 12.2% |
| Interquartile 75% (IQ3) | 17.0% | 17.1% |
| Interquartile Range (IQR) | 7.9% | 4.9% |
| Standard Deviation (Sample) | 8.3% | 5.3% |
| Standard Deviation (Population) | 8.3% | 5.3% |
Similar Demographics by Child Poverty Among Girls Under 16
Demographics Similar to Immigrants from Croatia by Child Poverty Among Girls Under 16
In terms of child poverty among girls under 16, the demographic groups most similar to Immigrants from Croatia are Palestinian (15.1%, a difference of 0.040%), Serbian (15.1%, a difference of 0.12%), Immigrants from Kazakhstan (15.1%, a difference of 0.19%), Immigrants from Brazil (15.1%, a difference of 0.20%), and Dutch (15.1%, a difference of 0.20%).
| Demographics | Rating | Rank | Child Poverty Among Girls Under 16 |
| British | 95.6 /100 | #103 | Exceptional 15.0% |
| Romanians | 95.3 /100 | #104 | Exceptional 15.0% |
| Immigrants | England | 95.1 /100 | #105 | Exceptional 15.1% |
| Chileans | 95.1 /100 | #106 | Exceptional 15.1% |
| Immigrants | Ukraine | 95.0 /100 | #107 | Exceptional 15.1% |
| Immigrants | Brazil | 94.9 /100 | #108 | Exceptional 15.1% |
| Serbians | 94.8 /100 | #109 | Exceptional 15.1% |
| Immigrants | Croatia | 94.6 /100 | #110 | Exceptional 15.1% |
| Palestinians | 94.5 /100 | #111 | Exceptional 15.1% |
| Immigrants | Kazakhstan | 94.3 /100 | #112 | Exceptional 15.1% |
| Dutch | 94.3 /100 | #113 | Exceptional 15.1% |
| Sri Lankans | 94.0 /100 | #114 | Exceptional 15.2% |
| Belgians | 93.9 /100 | #115 | Exceptional 15.2% |
| Immigrants | Denmark | 93.3 /100 | #116 | Exceptional 15.2% |
| Immigrants | North Macedonia | 93.1 /100 | #117 | Exceptional 15.2% |
Demographics Similar to Immigrants from Colombia by Child Poverty Among Girls Under 16
In terms of child poverty among girls under 16, the demographic groups most similar to Immigrants from Colombia are Immigrants from Oceania (16.1%, a difference of 0.070%), Immigrants from Germany (16.1%, a difference of 0.070%), South American (16.1%, a difference of 0.090%), French Canadian (16.1%, a difference of 0.11%), and Uruguayan (16.2%, a difference of 0.41%).
| Demographics | Rating | Rank | Child Poverty Among Girls Under 16 |
| Colombians | 76.1 /100 | #157 | Good 15.9% |
| Guamanians/Chamorros | 75.3 /100 | #158 | Good 15.9% |
| Slovaks | 75.2 /100 | #159 | Good 15.9% |
| French | 72.8 /100 | #160 | Good 16.0% |
| Immigrants | Northern Africa | 72.0 /100 | #161 | Good 16.0% |
| French Canadians | 68.7 /100 | #162 | Good 16.1% |
| Immigrants | Oceania | 68.4 /100 | #163 | Good 16.1% |
| Immigrants | Colombia | 67.8 /100 | #164 | Good 16.1% |
| Immigrants | Germany | 67.3 /100 | #165 | Good 16.1% |
| South Americans | 67.2 /100 | #166 | Good 16.1% |
| Uruguayans | 64.7 /100 | #167 | Good 16.2% |
| Yugoslavians | 64.4 /100 | #168 | Good 16.2% |
| Costa Ricans | 64.2 /100 | #169 | Good 16.2% |
| Immigrants | Venezuela | 64.2 /100 | #170 | Good 16.2% |
| Immigrants | Saudi Arabia | 64.0 /100 | #171 | Good 16.2% |