Immigrants from Croatia vs Immigrants from Norway Child Poverty Among Girls Under 16
COMPARE
Immigrants from Croatia
Immigrants from Norway
Child Poverty Among Girls Under 16
Child Poverty Among Girls Under 16 Comparison
Immigrants from Croatia
Immigrants from Norway
15.1%
CHILD POVERTY AMONG GIRLS UNDER 16
94.6/ 100
METRIC RATING
110th/ 347
METRIC RANK
15.4%
CHILD POVERTY AMONG GIRLS UNDER 16
90.8/ 100
METRIC RATING
127th/ 347
METRIC RANK
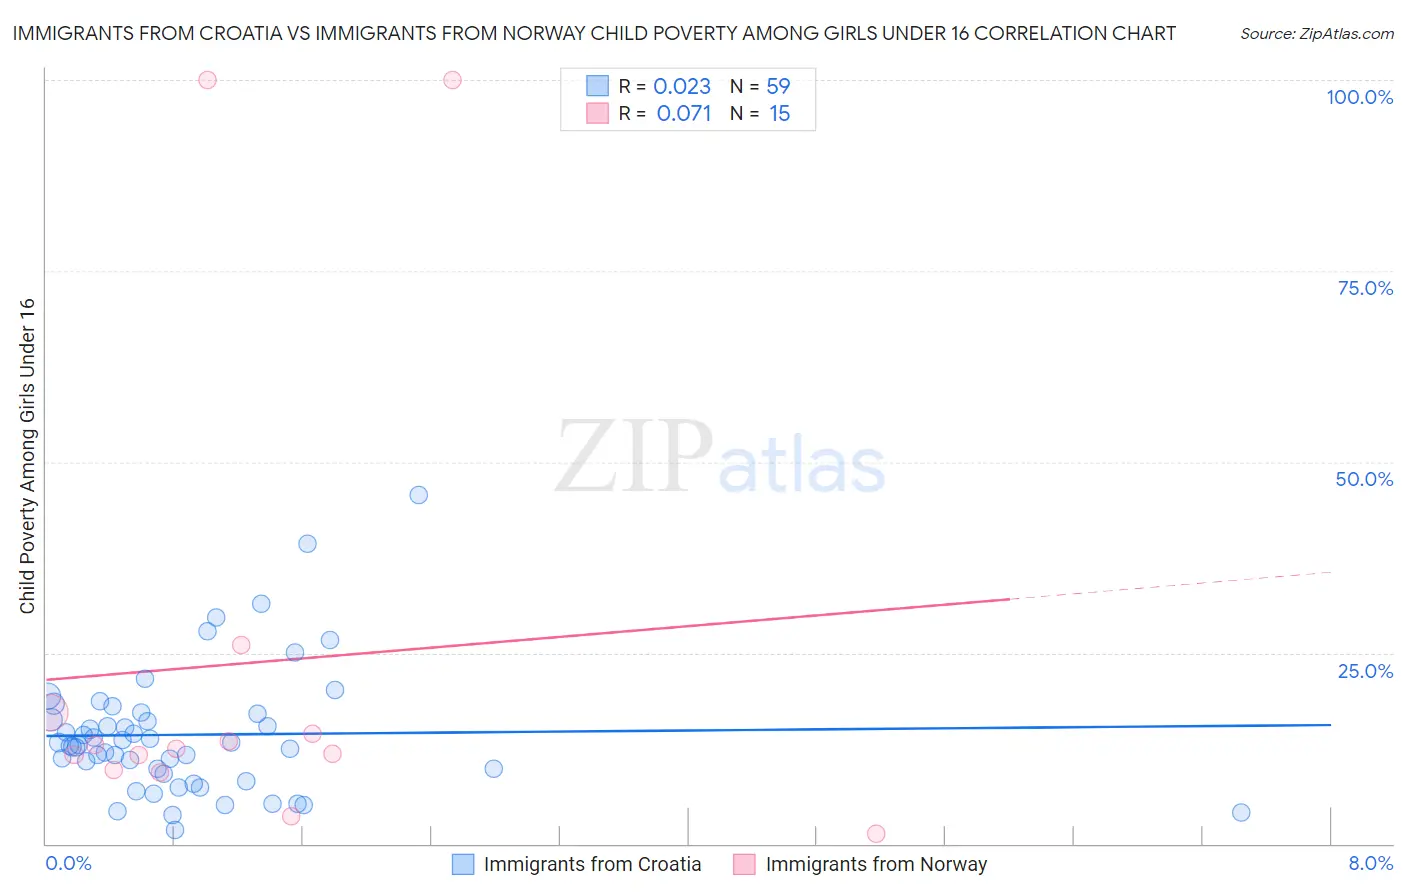
Immigrants from Croatia vs Immigrants from Norway Child Poverty Among Girls Under 16 Correlation Chart
The statistical analysis conducted on geographies consisting of 131,350,096 people shows no correlation between the proportion of Immigrants from Croatia and poverty level among girls under the age of 16 in the United States with a correlation coefficient (R) of 0.023 and weighted average of 15.1%. Similarly, the statistical analysis conducted on geographies consisting of 115,534,488 people shows a slight positive correlation between the proportion of Immigrants from Norway and poverty level among girls under the age of 16 in the United States with a correlation coefficient (R) of 0.071 and weighted average of 15.4%, a difference of 1.8%.
Child Poverty Among Girls Under 16 Correlation Summary
| Measurement | Immigrants from Croatia | Immigrants from Norway |
| Minimum | 1.9% | 1.3% |
| Maximum | 45.7% | 100.0% |
| Range | 43.8% | 98.7% |
| Mean | 14.3% | 23.7% |
| Median | 13.0% | 12.4% |
| Interquartile 25% (IQ1) | 9.1% | 9.7% |
| Interquartile 75% (IQ3) | 17.0% | 17.2% |
| Interquartile Range (IQR) | 7.9% | 7.5% |
| Standard Deviation (Sample) | 8.3% | 31.5% |
| Standard Deviation (Population) | 8.3% | 30.4% |
Demographics Similar to Immigrants from Croatia and Immigrants from Norway by Child Poverty Among Girls Under 16
In terms of child poverty among girls under 16, the demographic groups most similar to Immigrants from Croatia are Palestinian (15.1%, a difference of 0.040%), Serbian (15.1%, a difference of 0.12%), Immigrants from Kazakhstan (15.1%, a difference of 0.19%), Immigrants from Brazil (15.1%, a difference of 0.20%), and Dutch (15.1%, a difference of 0.20%). Similarly, the demographic groups most similar to Immigrants from Norway are Scottish (15.4%, a difference of 0.070%), Albanian (15.4%, a difference of 0.090%), Peruvian (15.4%, a difference of 0.13%), Carpatho Rusyn (15.3%, a difference of 0.24%), and Irish (15.3%, a difference of 0.29%).
| Demographics | Rating | Rank | Child Poverty Among Girls Under 16 |
| Immigrants | Brazil | 94.9 /100 | #108 | Exceptional 15.1% |
| Serbians | 94.8 /100 | #109 | Exceptional 15.1% |
| Immigrants | Croatia | 94.6 /100 | #110 | Exceptional 15.1% |
| Palestinians | 94.5 /100 | #111 | Exceptional 15.1% |
| Immigrants | Kazakhstan | 94.3 /100 | #112 | Exceptional 15.1% |
| Dutch | 94.3 /100 | #113 | Exceptional 15.1% |
| Sri Lankans | 94.0 /100 | #114 | Exceptional 15.2% |
| Belgians | 93.9 /100 | #115 | Exceptional 15.2% |
| Immigrants | Denmark | 93.3 /100 | #116 | Exceptional 15.2% |
| Immigrants | North Macedonia | 93.1 /100 | #117 | Exceptional 15.2% |
| Immigrants | Southern Europe | 92.7 /100 | #118 | Exceptional 15.3% |
| Immigrants | Zimbabwe | 92.5 /100 | #119 | Exceptional 15.3% |
| Pakistanis | 92.3 /100 | #120 | Exceptional 15.3% |
| English | 92.2 /100 | #121 | Exceptional 15.3% |
| Portuguese | 91.8 /100 | #122 | Exceptional 15.3% |
| Irish | 91.5 /100 | #123 | Exceptional 15.3% |
| Carpatho Rusyns | 91.4 /100 | #124 | Exceptional 15.3% |
| Peruvians | 91.2 /100 | #125 | Exceptional 15.4% |
| Scottish | 91.0 /100 | #126 | Exceptional 15.4% |
| Immigrants | Norway | 90.8 /100 | #127 | Exceptional 15.4% |
| Albanians | 90.5 /100 | #128 | Exceptional 15.4% |