Immigrants from Costa Rica vs Immigrants from Serbia Female Poverty
COMPARE
Immigrants from Costa Rica
Immigrants from Serbia
Female Poverty
Female Poverty Comparison
Immigrants from Costa Rica
Immigrants from Serbia
13.7%
FEMALE POVERTY
31.9/ 100
METRIC RATING
192nd/ 347
METRIC RANK
12.1%
FEMALE POVERTY
98.3/ 100
METRIC RATING
57th/ 347
METRIC RANK
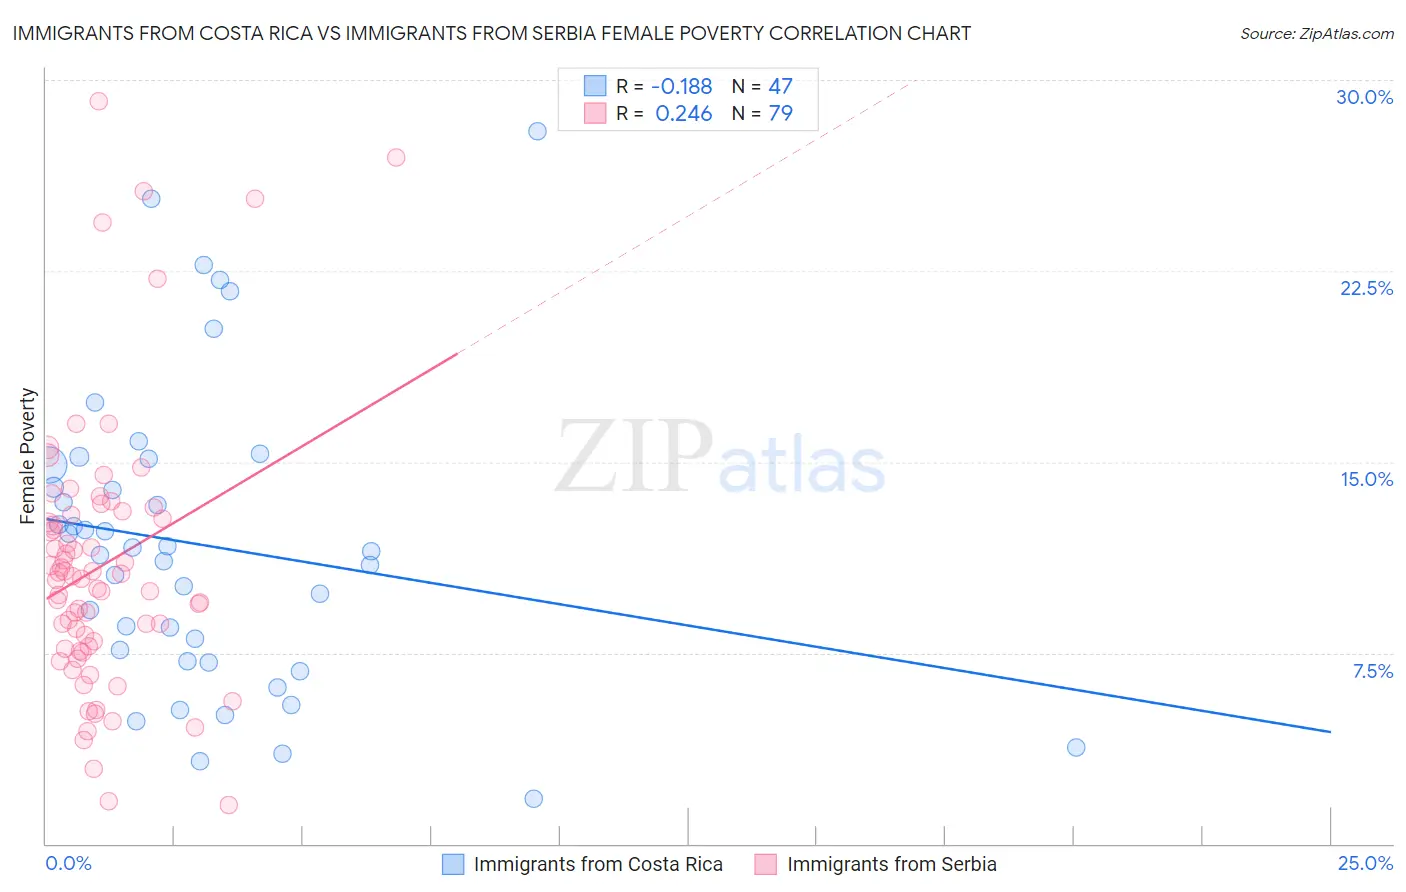
Immigrants from Costa Rica vs Immigrants from Serbia Female Poverty Correlation Chart
The statistical analysis conducted on geographies consisting of 204,242,933 people shows a poor negative correlation between the proportion of Immigrants from Costa Rica and poverty level among females in the United States with a correlation coefficient (R) of -0.188 and weighted average of 13.7%. Similarly, the statistical analysis conducted on geographies consisting of 131,723,325 people shows a weak positive correlation between the proportion of Immigrants from Serbia and poverty level among females in the United States with a correlation coefficient (R) of 0.246 and weighted average of 12.1%, a difference of 12.8%.
Female Poverty Correlation Summary
| Measurement | Immigrants from Costa Rica | Immigrants from Serbia |
| Minimum | 1.8% | 1.5% |
| Maximum | 28.0% | 29.2% |
| Range | 26.2% | 27.7% |
| Mean | 11.7% | 10.9% |
| Median | 11.5% | 10.4% |
| Interquartile 25% (IQ1) | 7.1% | 7.7% |
| Interquartile 75% (IQ3) | 14.9% | 12.9% |
| Interquartile Range (IQR) | 7.7% | 5.2% |
| Standard Deviation (Sample) | 5.9% | 5.4% |
| Standard Deviation (Population) | 5.8% | 5.4% |
Similar Demographics by Female Poverty
Demographics Similar to Immigrants from Costa Rica by Female Poverty
In terms of female poverty, the demographic groups most similar to Immigrants from Costa Rica are Iraqi (13.7%, a difference of 0.020%), Delaware (13.7%, a difference of 0.080%), Immigrants from Kuwait (13.7%, a difference of 0.090%), Sierra Leonean (13.7%, a difference of 0.13%), and Immigrants from South America (13.7%, a difference of 0.14%).
| Demographics | Rating | Rank | Female Poverty |
| Immigrants | Cameroon | 42.0 /100 | #185 | Average 13.5% |
| Immigrants | Portugal | 41.5 /100 | #186 | Average 13.6% |
| Immigrants | Venezuela | 41.0 /100 | #187 | Average 13.6% |
| Hawaiians | 39.9 /100 | #188 | Fair 13.6% |
| Uruguayans | 39.8 /100 | #189 | Fair 13.6% |
| Sierra Leoneans | 33.1 /100 | #190 | Fair 13.7% |
| Immigrants | Kuwait | 32.7 /100 | #191 | Fair 13.7% |
| Immigrants | Costa Rica | 31.9 /100 | #192 | Fair 13.7% |
| Iraqis | 31.8 /100 | #193 | Fair 13.7% |
| Delaware | 31.1 /100 | #194 | Fair 13.7% |
| Immigrants | South America | 30.6 /100 | #195 | Fair 13.7% |
| South American Indians | 28.9 /100 | #196 | Fair 13.7% |
| Arabs | 28.6 /100 | #197 | Fair 13.7% |
| Immigrants | Uganda | 28.5 /100 | #198 | Fair 13.7% |
| Immigrants | Lebanon | 25.6 /100 | #199 | Fair 13.8% |
Demographics Similar to Immigrants from Serbia by Female Poverty
In terms of female poverty, the demographic groups most similar to Immigrants from Serbia are Estonian (12.1%, a difference of 0.060%), Scandinavian (12.1%, a difference of 0.080%), Immigrants from Europe (12.1%, a difference of 0.090%), Immigrants from Sri Lanka (12.1%, a difference of 0.31%), and Immigrants from Australia (12.2%, a difference of 0.33%).
| Demographics | Rating | Rank | Female Poverty |
| Slovenes | 98.9 /100 | #50 | Exceptional 12.0% |
| Immigrants | Bulgaria | 98.9 /100 | #51 | Exceptional 12.0% |
| Immigrants | Croatia | 98.7 /100 | #52 | Exceptional 12.0% |
| Immigrants | Austria | 98.7 /100 | #53 | Exceptional 12.0% |
| Immigrants | Philippines | 98.7 /100 | #54 | Exceptional 12.1% |
| Immigrants | Sri Lanka | 98.5 /100 | #55 | Exceptional 12.1% |
| Estonians | 98.3 /100 | #56 | Exceptional 12.1% |
| Immigrants | Serbia | 98.3 /100 | #57 | Exceptional 12.1% |
| Scandinavians | 98.2 /100 | #58 | Exceptional 12.1% |
| Immigrants | Europe | 98.2 /100 | #59 | Exceptional 12.1% |
| Immigrants | Australia | 98.1 /100 | #60 | Exceptional 12.2% |
| Immigrants | Asia | 98.1 /100 | #61 | Exceptional 12.2% |
| Immigrants | Italy | 98.0 /100 | #62 | Exceptional 12.2% |
| Ukrainians | 98.0 /100 | #63 | Exceptional 12.2% |
| Germans | 98.0 /100 | #64 | Exceptional 12.2% |