Bulgarian vs Immigrants from Serbia Female Poverty
COMPARE
Bulgarian
Immigrants from Serbia
Female Poverty
Female Poverty Comparison
Bulgarians
Immigrants from Serbia
11.1%
FEMALE POVERTY
99.9/ 100
METRIC RATING
9th/ 347
METRIC RANK
12.1%
FEMALE POVERTY
98.3/ 100
METRIC RATING
57th/ 347
METRIC RANK
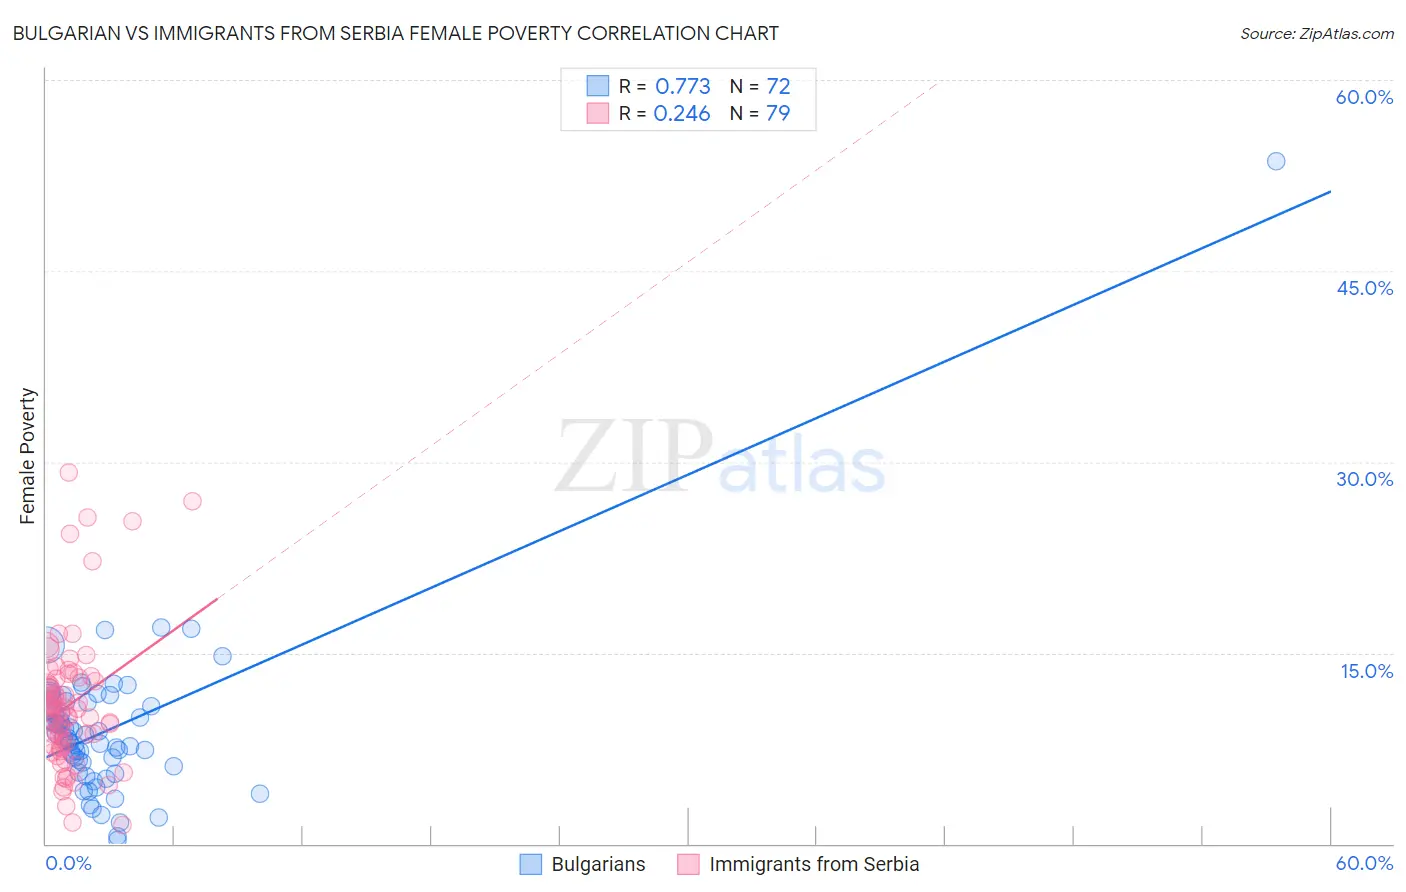
Bulgarian vs Immigrants from Serbia Female Poverty Correlation Chart
The statistical analysis conducted on geographies consisting of 205,544,553 people shows a strong positive correlation between the proportion of Bulgarians and poverty level among females in the United States with a correlation coefficient (R) of 0.773 and weighted average of 11.1%. Similarly, the statistical analysis conducted on geographies consisting of 131,723,325 people shows a weak positive correlation between the proportion of Immigrants from Serbia and poverty level among females in the United States with a correlation coefficient (R) of 0.246 and weighted average of 12.1%, a difference of 9.0%.
Female Poverty Correlation Summary
| Measurement | Bulgarian | Immigrants from Serbia |
| Minimum | 0.25% | 1.5% |
| Maximum | 53.6% | 29.2% |
| Range | 53.3% | 27.7% |
| Mean | 9.0% | 10.9% |
| Median | 8.5% | 10.4% |
| Interquartile 25% (IQ1) | 6.2% | 7.7% |
| Interquartile 75% (IQ3) | 11.1% | 12.9% |
| Interquartile Range (IQR) | 4.9% | 5.2% |
| Standard Deviation (Sample) | 6.5% | 5.4% |
| Standard Deviation (Population) | 6.4% | 5.4% |
Similar Demographics by Female Poverty
Demographics Similar to Bulgarians by Female Poverty
In terms of female poverty, the demographic groups most similar to Bulgarians are Immigrants from South Central Asia (11.1%, a difference of 0.19%), Immigrants from Hong Kong (11.2%, a difference of 0.80%), Assyrian/Chaldean/Syriac (11.0%, a difference of 0.89%), Maltese (11.2%, a difference of 0.91%), and Immigrants from Ireland (11.0%, a difference of 1.3%).
| Demographics | Rating | Rank | Female Poverty |
| Chinese | 100.0 /100 | #2 | Exceptional 10.4% |
| Thais | 100.0 /100 | #3 | Exceptional 10.5% |
| Immigrants | Taiwan | 100.0 /100 | #4 | Exceptional 10.5% |
| Filipinos | 100.0 /100 | #5 | Exceptional 10.9% |
| Immigrants | Ireland | 99.9 /100 | #6 | Exceptional 11.0% |
| Assyrians/Chaldeans/Syriacs | 99.9 /100 | #7 | Exceptional 11.0% |
| Immigrants | South Central Asia | 99.9 /100 | #8 | Exceptional 11.1% |
| Bulgarians | 99.9 /100 | #9 | Exceptional 11.1% |
| Immigrants | Hong Kong | 99.9 /100 | #10 | Exceptional 11.2% |
| Maltese | 99.9 /100 | #11 | Exceptional 11.2% |
| Bhutanese | 99.9 /100 | #12 | Exceptional 11.3% |
| Immigrants | Lithuania | 99.9 /100 | #13 | Exceptional 11.3% |
| Lithuanians | 99.8 /100 | #14 | Exceptional 11.4% |
| Latvians | 99.8 /100 | #15 | Exceptional 11.4% |
| Immigrants | Bolivia | 99.8 /100 | #16 | Exceptional 11.5% |
Demographics Similar to Immigrants from Serbia by Female Poverty
In terms of female poverty, the demographic groups most similar to Immigrants from Serbia are Estonian (12.1%, a difference of 0.060%), Scandinavian (12.1%, a difference of 0.080%), Immigrants from Europe (12.1%, a difference of 0.090%), Immigrants from Sri Lanka (12.1%, a difference of 0.31%), and Immigrants from Australia (12.2%, a difference of 0.33%).
| Demographics | Rating | Rank | Female Poverty |
| Slovenes | 98.9 /100 | #50 | Exceptional 12.0% |
| Immigrants | Bulgaria | 98.9 /100 | #51 | Exceptional 12.0% |
| Immigrants | Croatia | 98.7 /100 | #52 | Exceptional 12.0% |
| Immigrants | Austria | 98.7 /100 | #53 | Exceptional 12.0% |
| Immigrants | Philippines | 98.7 /100 | #54 | Exceptional 12.1% |
| Immigrants | Sri Lanka | 98.5 /100 | #55 | Exceptional 12.1% |
| Estonians | 98.3 /100 | #56 | Exceptional 12.1% |
| Immigrants | Serbia | 98.3 /100 | #57 | Exceptional 12.1% |
| Scandinavians | 98.2 /100 | #58 | Exceptional 12.1% |
| Immigrants | Europe | 98.2 /100 | #59 | Exceptional 12.1% |
| Immigrants | Australia | 98.1 /100 | #60 | Exceptional 12.2% |
| Immigrants | Asia | 98.1 /100 | #61 | Exceptional 12.2% |
| Immigrants | Italy | 98.0 /100 | #62 | Exceptional 12.2% |
| Ukrainians | 98.0 /100 | #63 | Exceptional 12.2% |
| Germans | 98.0 /100 | #64 | Exceptional 12.2% |