Immigrants from Congo vs Immigrants from Nigeria In Labor Force | Age 16-19
COMPARE
Immigrants from Congo
Immigrants from Nigeria
In Labor Force | Age 16-19
In Labor Force | Age 16-19 Comparison
Immigrants from Congo
Immigrants from Nigeria
41.7%
IN LABOR FORCE | AGE 16-19
100.0/ 100
METRIC RATING
37th/ 347
METRIC RANK
35.8%
IN LABOR FORCE | AGE 16-19
16.8/ 100
METRIC RATING
203rd/ 347
METRIC RANK
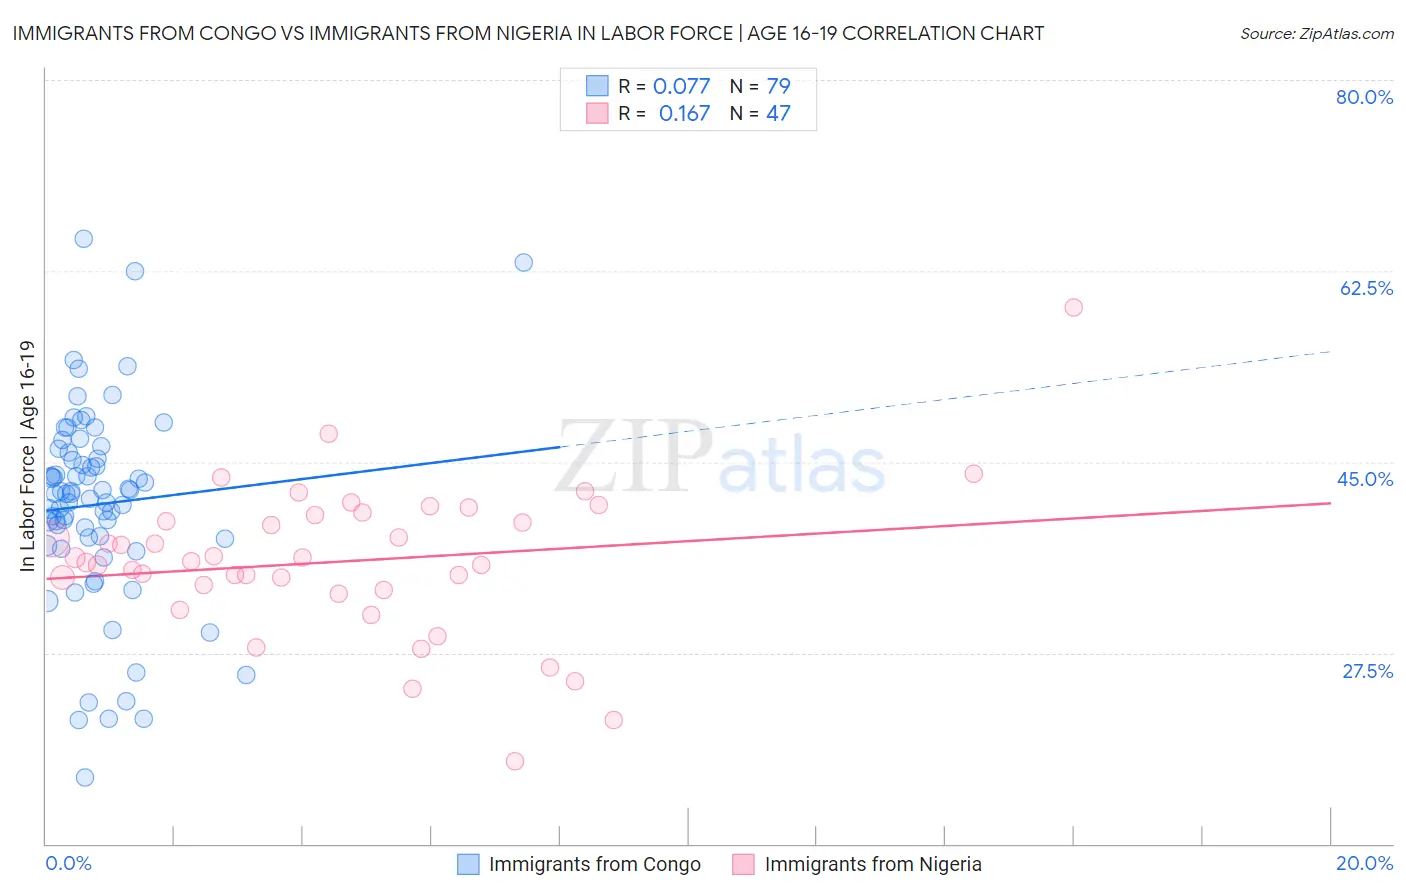
Immigrants from Congo vs Immigrants from Nigeria In Labor Force | Age 16-19 Correlation Chart
The statistical analysis conducted on geographies consisting of 92,123,036 people shows a slight positive correlation between the proportion of Immigrants from Congo and labor force participation rate among population between the ages 16 and 19 in the United States with a correlation coefficient (R) of 0.077 and weighted average of 41.7%. Similarly, the statistical analysis conducted on geographies consisting of 283,352,648 people shows a poor positive correlation between the proportion of Immigrants from Nigeria and labor force participation rate among population between the ages 16 and 19 in the United States with a correlation coefficient (R) of 0.167 and weighted average of 35.8%, a difference of 16.4%.
In Labor Force | Age 16-19 Correlation Summary
| Measurement | Immigrants from Congo | Immigrants from Nigeria |
| Minimum | 16.1% | 17.6% |
| Maximum | 65.5% | 59.1% |
| Range | 49.4% | 41.5% |
| Mean | 41.1% | 35.9% |
| Median | 42.1% | 35.9% |
| Interquartile 25% (IQ1) | 37.9% | 33.2% |
| Interquartile 75% (IQ3) | 45.9% | 40.2% |
| Interquartile Range (IQR) | 8.0% | 6.9% |
| Standard Deviation (Sample) | 9.1% | 7.0% |
| Standard Deviation (Population) | 9.1% | 6.9% |
Similar Demographics by In Labor Force | Age 16-19
Demographics Similar to Immigrants from Congo by In Labor Force | Age 16-19
In terms of in labor force | age 16-19, the demographic groups most similar to Immigrants from Congo are Immigrants from the Azores (41.7%, a difference of 0.080%), Yugoslavian (41.8%, a difference of 0.22%), Immigrants from Bosnia and Herzegovina (41.8%, a difference of 0.24%), Liberian (41.8%, a difference of 0.32%), and Sioux (41.5%, a difference of 0.35%).
| Demographics | Rating | Rank | In Labor Force | Age 16-19 |
| Scottish | 100.0 /100 | #30 | Exceptional 42.0% |
| Irish | 100.0 /100 | #31 | Exceptional 42.0% |
| Czechoslovakians | 100.0 /100 | #32 | Exceptional 41.9% |
| Liberians | 100.0 /100 | #33 | Exceptional 41.8% |
| Immigrants | Bosnia and Herzegovina | 100.0 /100 | #34 | Exceptional 41.8% |
| Yugoslavians | 100.0 /100 | #35 | Exceptional 41.8% |
| Immigrants | Azores | 100.0 /100 | #36 | Exceptional 41.7% |
| Immigrants | Congo | 100.0 /100 | #37 | Exceptional 41.7% |
| Sioux | 100.0 /100 | #38 | Exceptional 41.5% |
| Scotch-Irish | 100.0 /100 | #39 | Exceptional 41.5% |
| Immigrants | Liberia | 100.0 /100 | #40 | Exceptional 41.5% |
| Celtics | 100.0 /100 | #41 | Exceptional 41.3% |
| Whites/Caucasians | 100.0 /100 | #42 | Exceptional 41.3% |
| Tongans | 100.0 /100 | #43 | Exceptional 41.2% |
| Europeans | 100.0 /100 | #44 | Exceptional 41.1% |
Demographics Similar to Immigrants from Nigeria by In Labor Force | Age 16-19
In terms of in labor force | age 16-19, the demographic groups most similar to Immigrants from Nigeria are Senegalese (35.9%, a difference of 0.060%), Alsatian (35.9%, a difference of 0.070%), Immigrants from Albania (35.8%, a difference of 0.17%), Immigrants from Sweden (35.9%, a difference of 0.18%), and South American Indian (35.8%, a difference of 0.21%).
| Demographics | Rating | Rank | In Labor Force | Age 16-19 |
| Mexican American Indians | 21.1 /100 | #196 | Fair 36.0% |
| Immigrants | Serbia | 21.0 /100 | #197 | Fair 36.0% |
| Immigrants | Northern Africa | 19.9 /100 | #198 | Poor 35.9% |
| Immigrants | Norway | 19.8 /100 | #199 | Poor 35.9% |
| Immigrants | Sweden | 18.8 /100 | #200 | Poor 35.9% |
| Alsatians | 17.5 /100 | #201 | Poor 35.9% |
| Senegalese | 17.4 /100 | #202 | Poor 35.9% |
| Immigrants | Nigeria | 16.8 /100 | #203 | Poor 35.8% |
| Immigrants | Albania | 15.0 /100 | #204 | Poor 35.8% |
| South American Indians | 14.6 /100 | #205 | Poor 35.8% |
| Chileans | 14.6 /100 | #206 | Poor 35.8% |
| Immigrants | Eastern Europe | 14.5 /100 | #207 | Poor 35.8% |
| Koreans | 13.3 /100 | #208 | Poor 35.7% |
| Moroccans | 12.7 /100 | #209 | Poor 35.7% |
| Immigrants | Switzerland | 11.9 /100 | #210 | Poor 35.6% |