Immigrants from Ethiopia vs Trinidadian and Tobagonian Seniors Poverty Over the Age of 75
COMPARE
Immigrants from Ethiopia
Trinidadian and Tobagonian
Seniors Poverty Over the Age of 75
Seniors Poverty Over the Age of 75 Comparison
Immigrants from Ethiopia
Trinidadians and Tobagonians
11.6%
SENIORS POVERTY OVER THE AGE OF 75
91.7/ 100
METRIC RATING
99th/ 347
METRIC RANK
15.9%
SENIORS POVERTY OVER THE AGE OF 75
0.0/ 100
METRIC RATING
311th/ 347
METRIC RANK
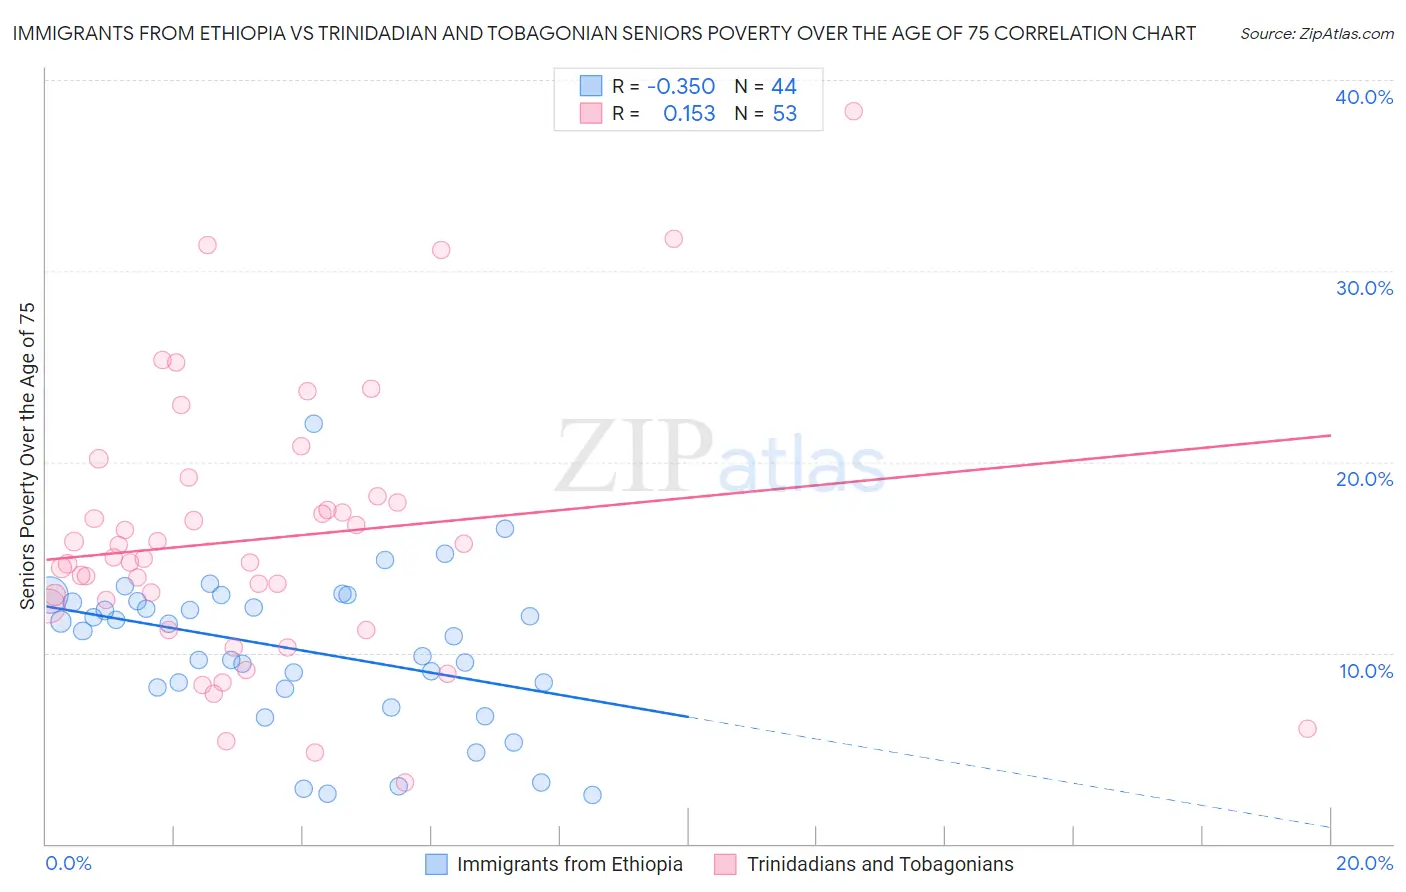
Immigrants from Ethiopia vs Trinidadian and Tobagonian Seniors Poverty Over the Age of 75 Correlation Chart
The statistical analysis conducted on geographies consisting of 210,209,195 people shows a mild negative correlation between the proportion of Immigrants from Ethiopia and poverty level among seniors over the age of 75 in the United States with a correlation coefficient (R) of -0.350 and weighted average of 11.6%. Similarly, the statistical analysis conducted on geographies consisting of 218,354,994 people shows a poor positive correlation between the proportion of Trinidadians and Tobagonians and poverty level among seniors over the age of 75 in the United States with a correlation coefficient (R) of 0.153 and weighted average of 15.9%, a difference of 36.9%.
Seniors Poverty Over the Age of 75 Correlation Summary
| Measurement | Immigrants from Ethiopia | Trinidadian and Tobagonian |
| Minimum | 2.6% | 3.2% |
| Maximum | 22.0% | 38.3% |
| Range | 19.4% | 35.1% |
| Mean | 10.2% | 16.0% |
| Median | 11.0% | 14.9% |
| Interquartile 25% (IQ1) | 8.1% | 11.8% |
| Interquartile 75% (IQ3) | 12.7% | 18.0% |
| Interquartile Range (IQR) | 4.5% | 6.2% |
| Standard Deviation (Sample) | 4.0% | 7.0% |
| Standard Deviation (Population) | 4.0% | 7.0% |
Similar Demographics by Seniors Poverty Over the Age of 75
Demographics Similar to Immigrants from Ethiopia by Seniors Poverty Over the Age of 75
In terms of seniors poverty over the age of 75, the demographic groups most similar to Immigrants from Ethiopia are Immigrants from Japan (11.6%, a difference of 0.070%), Syrian (11.6%, a difference of 0.16%), Romanian (11.6%, a difference of 0.18%), Jordanian (11.6%, a difference of 0.24%), and Immigrants from Bosnia and Herzegovina (11.6%, a difference of 0.27%).
| Demographics | Rating | Rank | Seniors Poverty Over the Age of 75 |
| Kenyans | 93.9 /100 | #92 | Exceptional 11.5% |
| Immigrants | Poland | 92.9 /100 | #93 | Exceptional 11.6% |
| Creek | 92.7 /100 | #94 | Exceptional 11.6% |
| Immigrants | Bosnia and Herzegovina | 92.6 /100 | #95 | Exceptional 11.6% |
| Immigrants | Sweden | 92.6 /100 | #96 | Exceptional 11.6% |
| Romanians | 92.3 /100 | #97 | Exceptional 11.6% |
| Immigrants | Japan | 91.9 /100 | #98 | Exceptional 11.6% |
| Immigrants | Ethiopia | 91.7 /100 | #99 | Exceptional 11.6% |
| Syrians | 91.1 /100 | #100 | Exceptional 11.6% |
| Jordanians | 90.8 /100 | #101 | Exceptional 11.6% |
| Guamanians/Chamorros | 90.6 /100 | #102 | Exceptional 11.6% |
| Immigrants | Kuwait | 90.5 /100 | #103 | Exceptional 11.6% |
| Immigrants | Singapore | 90.3 /100 | #104 | Exceptional 11.6% |
| Chickasaw | 90.2 /100 | #105 | Exceptional 11.6% |
| Russians | 89.9 /100 | #106 | Excellent 11.6% |
Demographics Similar to Trinidadians and Tobagonians by Seniors Poverty Over the Age of 75
In terms of seniors poverty over the age of 75, the demographic groups most similar to Trinidadians and Tobagonians are Vietnamese (15.9%, a difference of 0.10%), Yup'ik (15.8%, a difference of 0.20%), Crow (15.9%, a difference of 0.41%), Immigrants from Bangladesh (15.8%, a difference of 0.50%), and Immigrants from West Indies (15.8%, a difference of 0.55%).
| Demographics | Rating | Rank | Seniors Poverty Over the Age of 75 |
| Immigrants | Trinidad and Tobago | 0.0 /100 | #304 | Tragic 15.7% |
| Ecuadorians | 0.0 /100 | #305 | Tragic 15.7% |
| Hispanics or Latinos | 0.0 /100 | #306 | Tragic 15.8% |
| Immigrants | West Indies | 0.0 /100 | #307 | Tragic 15.8% |
| Immigrants | Bangladesh | 0.0 /100 | #308 | Tragic 15.8% |
| Yup'ik | 0.0 /100 | #309 | Tragic 15.8% |
| Vietnamese | 0.0 /100 | #310 | Tragic 15.9% |
| Trinidadians and Tobagonians | 0.0 /100 | #311 | Tragic 15.9% |
| Crow | 0.0 /100 | #312 | Tragic 15.9% |
| Barbadians | 0.0 /100 | #313 | Tragic 16.0% |
| Tsimshian | 0.0 /100 | #314 | Tragic 16.1% |
| Guyanese | 0.0 /100 | #315 | Tragic 16.1% |
| Immigrants | Ecuador | 0.0 /100 | #316 | Tragic 16.1% |
| Immigrants | Guyana | 0.0 /100 | #317 | Tragic 16.2% |
| Houma | 0.0 /100 | #318 | Tragic 16.2% |