Immigrants from Chile vs Dominican Seniors Poverty Over the Age of 65
COMPARE
Immigrants from Chile
Dominican
Seniors Poverty Over the Age of 65
Seniors Poverty Over the Age of 65 Comparison
Immigrants from Chile
Dominicans
11.7%
SENIORS POVERTY OVER THE AGE OF 65
3.9/ 100
METRIC RATING
222nd/ 347
METRIC RANK
17.8%
SENIORS POVERTY OVER THE AGE OF 65
0.0/ 100
METRIC RATING
341st/ 347
METRIC RANK
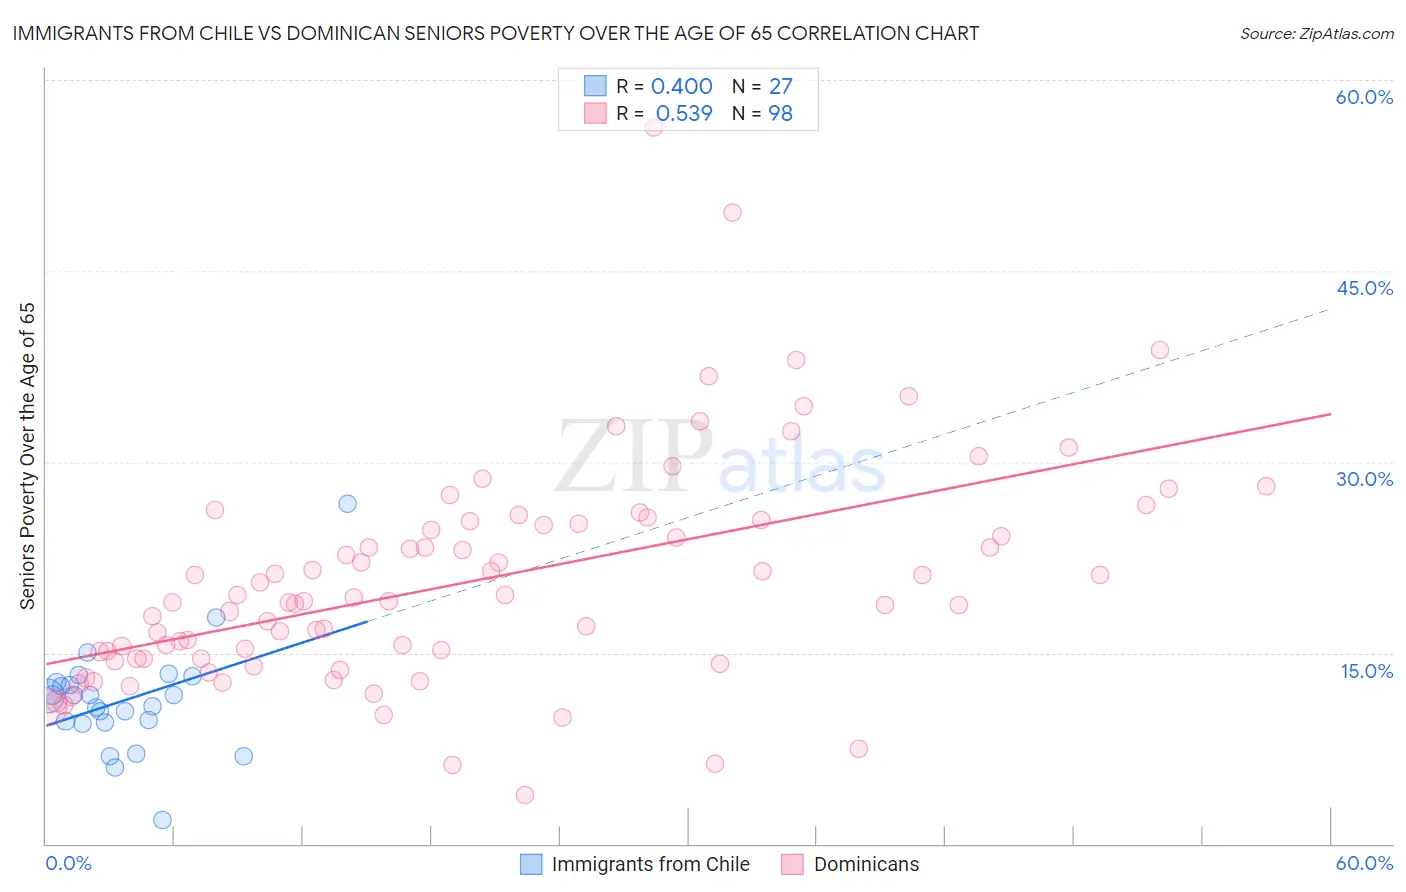
Immigrants from Chile vs Dominican Seniors Poverty Over the Age of 65 Correlation Chart
The statistical analysis conducted on geographies consisting of 218,369,529 people shows a mild positive correlation between the proportion of Immigrants from Chile and poverty level among seniors over the age of 65 in the United States with a correlation coefficient (R) of 0.400 and weighted average of 11.7%. Similarly, the statistical analysis conducted on geographies consisting of 353,426,672 people shows a substantial positive correlation between the proportion of Dominicans and poverty level among seniors over the age of 65 in the United States with a correlation coefficient (R) of 0.539 and weighted average of 17.8%, a difference of 52.3%.
Seniors Poverty Over the Age of 65 Correlation Summary
| Measurement | Immigrants from Chile | Dominican |
| Minimum | 1.9% | 3.8% |
| Maximum | 26.7% | 56.3% |
| Range | 24.8% | 52.5% |
| Mean | 11.3% | 20.6% |
| Median | 11.6% | 19.0% |
| Interquartile 25% (IQ1) | 9.5% | 14.5% |
| Interquartile 75% (IQ3) | 12.7% | 25.2% |
| Interquartile Range (IQR) | 3.1% | 10.6% |
| Standard Deviation (Sample) | 4.4% | 8.7% |
| Standard Deviation (Population) | 4.3% | 8.7% |
Similar Demographics by Seniors Poverty Over the Age of 65
Demographics Similar to Immigrants from Chile by Seniors Poverty Over the Age of 65
In terms of seniors poverty over the age of 65, the demographic groups most similar to Immigrants from Chile are Immigrants from Congo (11.7%, a difference of 0.040%), Argentinean (11.7%, a difference of 0.12%), Peruvian (11.7%, a difference of 0.18%), Immigrants from Nigeria (11.7%, a difference of 0.28%), and Immigrants from Belarus (11.8%, a difference of 0.38%).
| Demographics | Rating | Rank | Seniors Poverty Over the Age of 65 |
| French American Indians | 8.7 /100 | #215 | Tragic 11.5% |
| Immigrants | Morocco | 6.8 /100 | #216 | Tragic 11.6% |
| Immigrants | Africa | 6.4 /100 | #217 | Tragic 11.6% |
| Immigrants | Ukraine | 5.7 /100 | #218 | Tragic 11.6% |
| Arapaho | 5.2 /100 | #219 | Tragic 11.6% |
| Peruvians | 4.2 /100 | #220 | Tragic 11.7% |
| Argentineans | 4.1 /100 | #221 | Tragic 11.7% |
| Immigrants | Chile | 3.9 /100 | #222 | Tragic 11.7% |
| Immigrants | Congo | 3.8 /100 | #223 | Tragic 11.7% |
| Immigrants | Nigeria | 3.4 /100 | #224 | Tragic 11.7% |
| Immigrants | Belarus | 3.2 /100 | #225 | Tragic 11.8% |
| Liberians | 3.2 /100 | #226 | Tragic 11.8% |
| Nigerians | 3.2 /100 | #227 | Tragic 11.8% |
| Immigrants | Costa Rica | 2.7 /100 | #228 | Tragic 11.8% |
| Immigrants | Eritrea | 2.6 /100 | #229 | Tragic 11.8% |
Demographics Similar to Dominicans by Seniors Poverty Over the Age of 65
In terms of seniors poverty over the age of 65, the demographic groups most similar to Dominicans are Hopi (17.8%, a difference of 0.39%), Immigrants from Cuba (17.9%, a difference of 0.48%), Lumbee (18.1%, a difference of 1.6%), Navajo (17.5%, a difference of 2.3%), and Immigrants from Dominican Republic (18.3%, a difference of 2.5%).
| Demographics | Rating | Rank | Seniors Poverty Over the Age of 65 |
| Immigrants | Yemen | 0.0 /100 | #333 | Tragic 15.9% |
| Immigrants | Nicaragua | 0.0 /100 | #334 | Tragic 15.9% |
| Cubans | 0.0 /100 | #335 | Tragic 16.1% |
| Immigrants | Cabo Verde | 0.0 /100 | #336 | Tragic 16.2% |
| Immigrants | Caribbean | 0.0 /100 | #337 | Tragic 16.5% |
| Pueblo | 0.0 /100 | #338 | Tragic 17.2% |
| Navajo | 0.0 /100 | #339 | Tragic 17.5% |
| Hopi | 0.0 /100 | #340 | Tragic 17.8% |
| Dominicans | 0.0 /100 | #341 | Tragic 17.8% |
| Immigrants | Cuba | 0.0 /100 | #342 | Tragic 17.9% |
| Lumbee | 0.0 /100 | #343 | Tragic 18.1% |
| Immigrants | Dominican Republic | 0.0 /100 | #344 | Tragic 18.3% |
| Pima | 0.0 /100 | #345 | Tragic 19.8% |
| Tohono O'odham | 0.0 /100 | #346 | Tragic 20.8% |
| Puerto Ricans | 0.0 /100 | #347 | Tragic 21.4% |