Immigrants from Central America vs Cuban Female Poverty Among 25-34 Year Olds
COMPARE
Immigrants from Central America
Cuban
Female Poverty Among 25-34 Year Olds
Female Poverty Among 25-34 Year Olds Comparison
Immigrants from Central America
Cubans
16.6%
FEMALE POVERTY AMONG 25-34 YEAR OLDS
0.0/ 100
METRIC RATING
294th/ 347
METRIC RANK
14.7%
FEMALE POVERTY AMONG 25-34 YEAR OLDS
1.6/ 100
METRIC RATING
234th/ 347
METRIC RANK
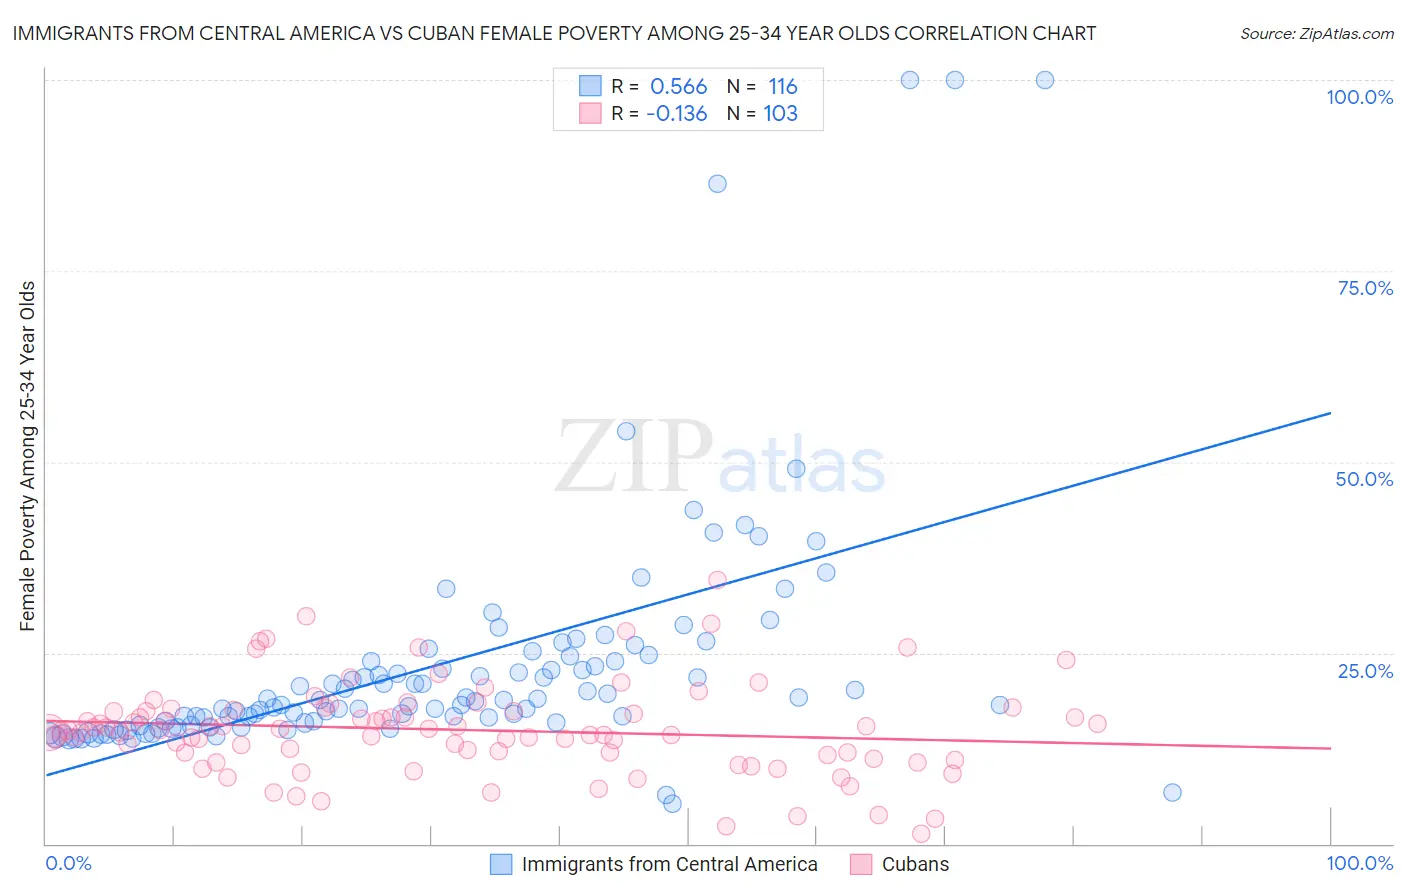
Immigrants from Central America vs Cuban Female Poverty Among 25-34 Year Olds Correlation Chart
The statistical analysis conducted on geographies consisting of 522,040,118 people shows a substantial positive correlation between the proportion of Immigrants from Central America and poverty level among females between the ages 25 and 34 in the United States with a correlation coefficient (R) of 0.566 and weighted average of 16.6%. Similarly, the statistical analysis conducted on geographies consisting of 440,903,752 people shows a poor negative correlation between the proportion of Cubans and poverty level among females between the ages 25 and 34 in the United States with a correlation coefficient (R) of -0.136 and weighted average of 14.7%, a difference of 12.8%.
Female Poverty Among 25-34 Year Olds Correlation Summary
| Measurement | Immigrants from Central America | Cuban |
| Minimum | 5.3% | 1.3% |
| Maximum | 100.0% | 34.5% |
| Range | 94.7% | 33.3% |
| Mean | 23.3% | 14.9% |
| Median | 18.5% | 14.7% |
| Interquartile 25% (IQ1) | 15.6% | 11.7% |
| Interquartile 75% (IQ3) | 23.9% | 17.4% |
| Interquartile Range (IQR) | 8.2% | 5.7% |
| Standard Deviation (Sample) | 16.1% | 6.0% |
| Standard Deviation (Population) | 16.0% | 6.0% |
Similar Demographics by Female Poverty Among 25-34 Year Olds
Demographics Similar to Immigrants from Central America by Female Poverty Among 25-34 Year Olds
In terms of female poverty among 25-34 year olds, the demographic groups most similar to Immigrants from Central America are Mexican (16.6%, a difference of 0.080%), Hispanic or Latino (16.6%, a difference of 0.27%), Immigrants from Guatemala (16.6%, a difference of 0.33%), Potawatomi (16.5%, a difference of 0.36%), and Immigrants from Dominica (16.5%, a difference of 0.63%).
| Demographics | Rating | Rank | Female Poverty Among 25-34 Year Olds |
| Americans | 0.0 /100 | #287 | Tragic 16.4% |
| Guatemalans | 0.0 /100 | #288 | Tragic 16.4% |
| Osage | 0.0 /100 | #289 | Tragic 16.4% |
| Indonesians | 0.0 /100 | #290 | Tragic 16.4% |
| Comanche | 0.0 /100 | #291 | Tragic 16.5% |
| Immigrants | Dominica | 0.0 /100 | #292 | Tragic 16.5% |
| Potawatomi | 0.0 /100 | #293 | Tragic 16.5% |
| Immigrants | Central America | 0.0 /100 | #294 | Tragic 16.6% |
| Mexicans | 0.0 /100 | #295 | Tragic 16.6% |
| Hispanics or Latinos | 0.0 /100 | #296 | Tragic 16.6% |
| Immigrants | Guatemala | 0.0 /100 | #297 | Tragic 16.6% |
| Blackfeet | 0.0 /100 | #298 | Tragic 16.7% |
| Spanish Americans | 0.0 /100 | #299 | Tragic 16.7% |
| U.S. Virgin Islanders | 0.0 /100 | #300 | Tragic 16.7% |
| Immigrants | Congo | 0.0 /100 | #301 | Tragic 16.7% |
Demographics Similar to Cubans by Female Poverty Among 25-34 Year Olds
In terms of female poverty among 25-34 year olds, the demographic groups most similar to Cubans are Immigrants from Jamaica (14.7%, a difference of 0.18%), Salvadoran (14.7%, a difference of 0.20%), Immigrants from Ghana (14.7%, a difference of 0.20%), White/Caucasian (14.7%, a difference of 0.23%), and Alsatian (14.7%, a difference of 0.24%).
| Demographics | Rating | Rank | Female Poverty Among 25-34 Year Olds |
| Celtics | 2.8 /100 | #227 | Tragic 14.5% |
| Vietnamese | 2.6 /100 | #228 | Tragic 14.6% |
| Spanish | 2.5 /100 | #229 | Tragic 14.6% |
| Spaniards | 2.3 /100 | #230 | Tragic 14.6% |
| Delaware | 2.3 /100 | #231 | Tragic 14.6% |
| Immigrants | Ecuador | 1.9 /100 | #232 | Tragic 14.6% |
| Whites/Caucasians | 1.8 /100 | #233 | Tragic 14.7% |
| Cubans | 1.6 /100 | #234 | Tragic 14.7% |
| Immigrants | Jamaica | 1.4 /100 | #235 | Tragic 14.7% |
| Salvadorans | 1.4 /100 | #236 | Tragic 14.7% |
| Immigrants | Ghana | 1.4 /100 | #237 | Tragic 14.7% |
| Alsatians | 1.4 /100 | #238 | Tragic 14.7% |
| Malaysians | 1.4 /100 | #239 | Tragic 14.7% |
| Immigrants | Grenada | 1.3 /100 | #240 | Tragic 14.7% |
| Scotch-Irish | 1.2 /100 | #241 | Tragic 14.8% |