Immigrants from Central America vs Immigrants from Pakistan Female Poverty Among 25-34 Year Olds
COMPARE
Immigrants from Central America
Immigrants from Pakistan
Female Poverty Among 25-34 Year Olds
Female Poverty Among 25-34 Year Olds Comparison
Immigrants from Central America
Immigrants from Pakistan
16.6%
FEMALE POVERTY AMONG 25-34 YEAR OLDS
0.0/ 100
METRIC RATING
294th/ 347
METRIC RANK
11.5%
FEMALE POVERTY AMONG 25-34 YEAR OLDS
99.9/ 100
METRIC RATING
28th/ 347
METRIC RANK
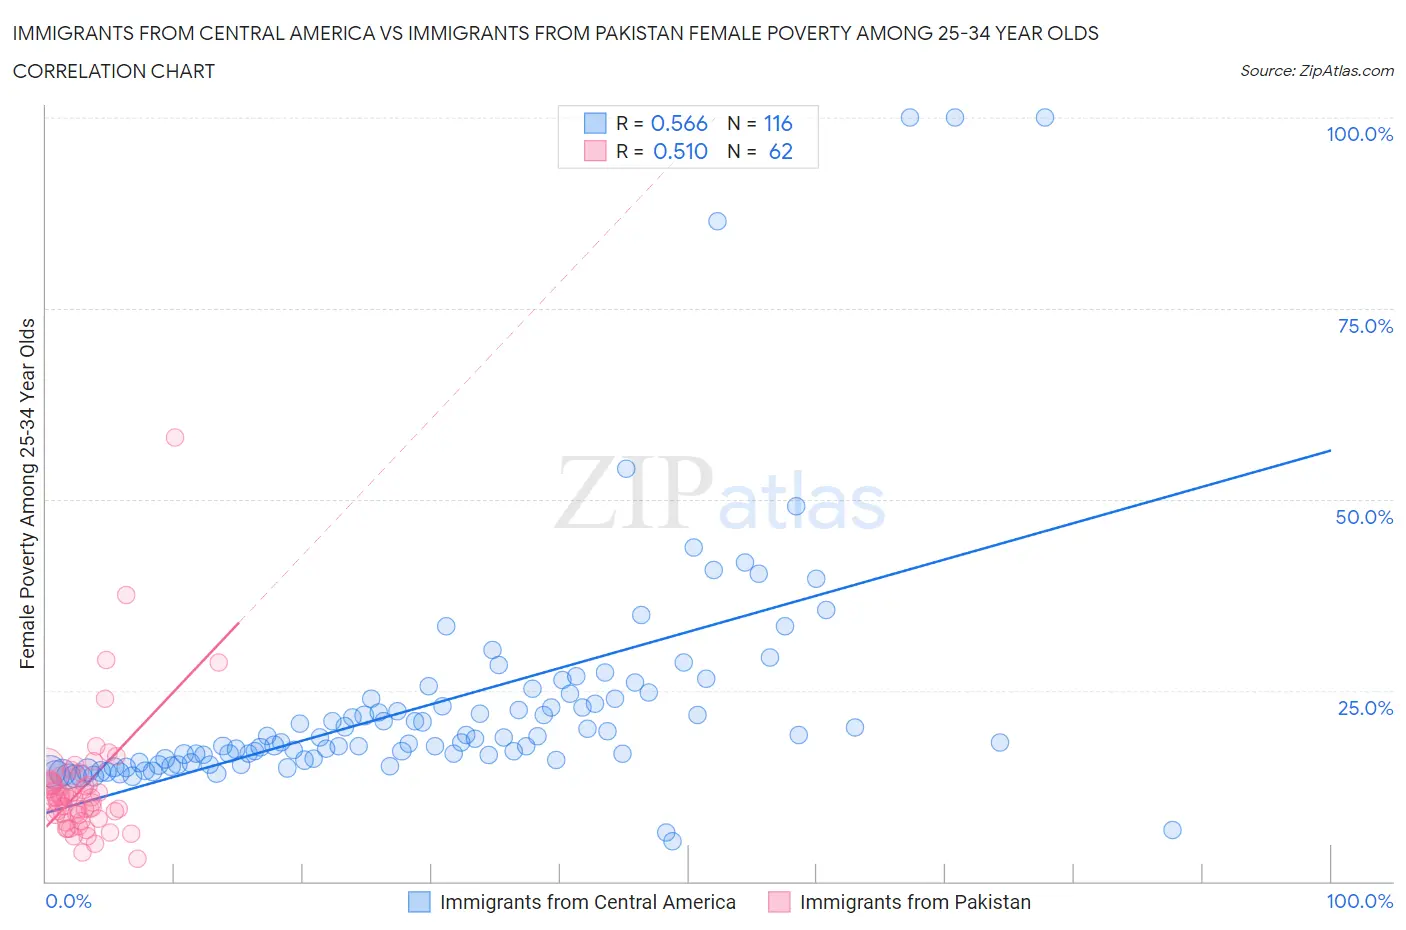
Immigrants from Central America vs Immigrants from Pakistan Female Poverty Among 25-34 Year Olds Correlation Chart
The statistical analysis conducted on geographies consisting of 522,040,118 people shows a substantial positive correlation between the proportion of Immigrants from Central America and poverty level among females between the ages 25 and 34 in the United States with a correlation coefficient (R) of 0.566 and weighted average of 16.6%. Similarly, the statistical analysis conducted on geographies consisting of 280,519,839 people shows a substantial positive correlation between the proportion of Immigrants from Pakistan and poverty level among females between the ages 25 and 34 in the United States with a correlation coefficient (R) of 0.510 and weighted average of 11.5%, a difference of 43.8%.
Female Poverty Among 25-34 Year Olds Correlation Summary
| Measurement | Immigrants from Central America | Immigrants from Pakistan |
| Minimum | 5.3% | 3.0% |
| Maximum | 100.0% | 58.0% |
| Range | 94.7% | 55.1% |
| Mean | 23.3% | 12.3% |
| Median | 18.5% | 10.9% |
| Interquartile 25% (IQ1) | 15.6% | 8.6% |
| Interquartile 75% (IQ3) | 23.9% | 12.8% |
| Interquartile Range (IQR) | 8.2% | 4.2% |
| Standard Deviation (Sample) | 16.1% | 8.3% |
| Standard Deviation (Population) | 16.0% | 8.3% |
Similar Demographics by Female Poverty Among 25-34 Year Olds
Demographics Similar to Immigrants from Central America by Female Poverty Among 25-34 Year Olds
In terms of female poverty among 25-34 year olds, the demographic groups most similar to Immigrants from Central America are Mexican (16.6%, a difference of 0.080%), Hispanic or Latino (16.6%, a difference of 0.27%), Immigrants from Guatemala (16.6%, a difference of 0.33%), Potawatomi (16.5%, a difference of 0.36%), and Immigrants from Dominica (16.5%, a difference of 0.63%).
| Demographics | Rating | Rank | Female Poverty Among 25-34 Year Olds |
| Americans | 0.0 /100 | #287 | Tragic 16.4% |
| Guatemalans | 0.0 /100 | #288 | Tragic 16.4% |
| Osage | 0.0 /100 | #289 | Tragic 16.4% |
| Indonesians | 0.0 /100 | #290 | Tragic 16.4% |
| Comanche | 0.0 /100 | #291 | Tragic 16.5% |
| Immigrants | Dominica | 0.0 /100 | #292 | Tragic 16.5% |
| Potawatomi | 0.0 /100 | #293 | Tragic 16.5% |
| Immigrants | Central America | 0.0 /100 | #294 | Tragic 16.6% |
| Mexicans | 0.0 /100 | #295 | Tragic 16.6% |
| Hispanics or Latinos | 0.0 /100 | #296 | Tragic 16.6% |
| Immigrants | Guatemala | 0.0 /100 | #297 | Tragic 16.6% |
| Blackfeet | 0.0 /100 | #298 | Tragic 16.7% |
| Spanish Americans | 0.0 /100 | #299 | Tragic 16.7% |
| U.S. Virgin Islanders | 0.0 /100 | #300 | Tragic 16.7% |
| Immigrants | Congo | 0.0 /100 | #301 | Tragic 16.7% |
Demographics Similar to Immigrants from Pakistan by Female Poverty Among 25-34 Year Olds
In terms of female poverty among 25-34 year olds, the demographic groups most similar to Immigrants from Pakistan are Bulgarian (11.5%, a difference of 0.0%), Cypriot (11.5%, a difference of 0.030%), Immigrants from Greece (11.5%, a difference of 0.24%), Immigrants from Japan (11.6%, a difference of 0.32%), and Tongan (11.5%, a difference of 0.54%).
| Demographics | Rating | Rank | Female Poverty Among 25-34 Year Olds |
| Turks | 100.0 /100 | #21 | Exceptional 11.4% |
| Asians | 99.9 /100 | #22 | Exceptional 11.4% |
| Bolivians | 99.9 /100 | #23 | Exceptional 11.4% |
| Maltese | 99.9 /100 | #24 | Exceptional 11.4% |
| Bhutanese | 99.9 /100 | #25 | Exceptional 11.4% |
| Tongans | 99.9 /100 | #26 | Exceptional 11.5% |
| Immigrants | Greece | 99.9 /100 | #27 | Exceptional 11.5% |
| Immigrants | Pakistan | 99.9 /100 | #28 | Exceptional 11.5% |
| Bulgarians | 99.9 /100 | #29 | Exceptional 11.5% |
| Cypriots | 99.9 /100 | #30 | Exceptional 11.5% |
| Immigrants | Japan | 99.9 /100 | #31 | Exceptional 11.6% |
| Immigrants | Asia | 99.9 /100 | #32 | Exceptional 11.6% |
| Immigrants | Poland | 99.9 /100 | #33 | Exceptional 11.6% |
| Zimbabweans | 99.9 /100 | #34 | Exceptional 11.7% |
| Cambodians | 99.9 /100 | #35 | Exceptional 11.7% |