Immigrants from Central America vs Immigrants from North America Female Poverty Among 25-34 Year Olds
COMPARE
Immigrants from Central America
Immigrants from North America
Female Poverty Among 25-34 Year Olds
Female Poverty Among 25-34 Year Olds Comparison
Immigrants from Central America
Immigrants from North America
16.6%
FEMALE POVERTY AMONG 25-34 YEAR OLDS
0.0/ 100
METRIC RATING
294th/ 347
METRIC RANK
12.9%
FEMALE POVERTY AMONG 25-34 YEAR OLDS
89.7/ 100
METRIC RATING
129th/ 347
METRIC RANK
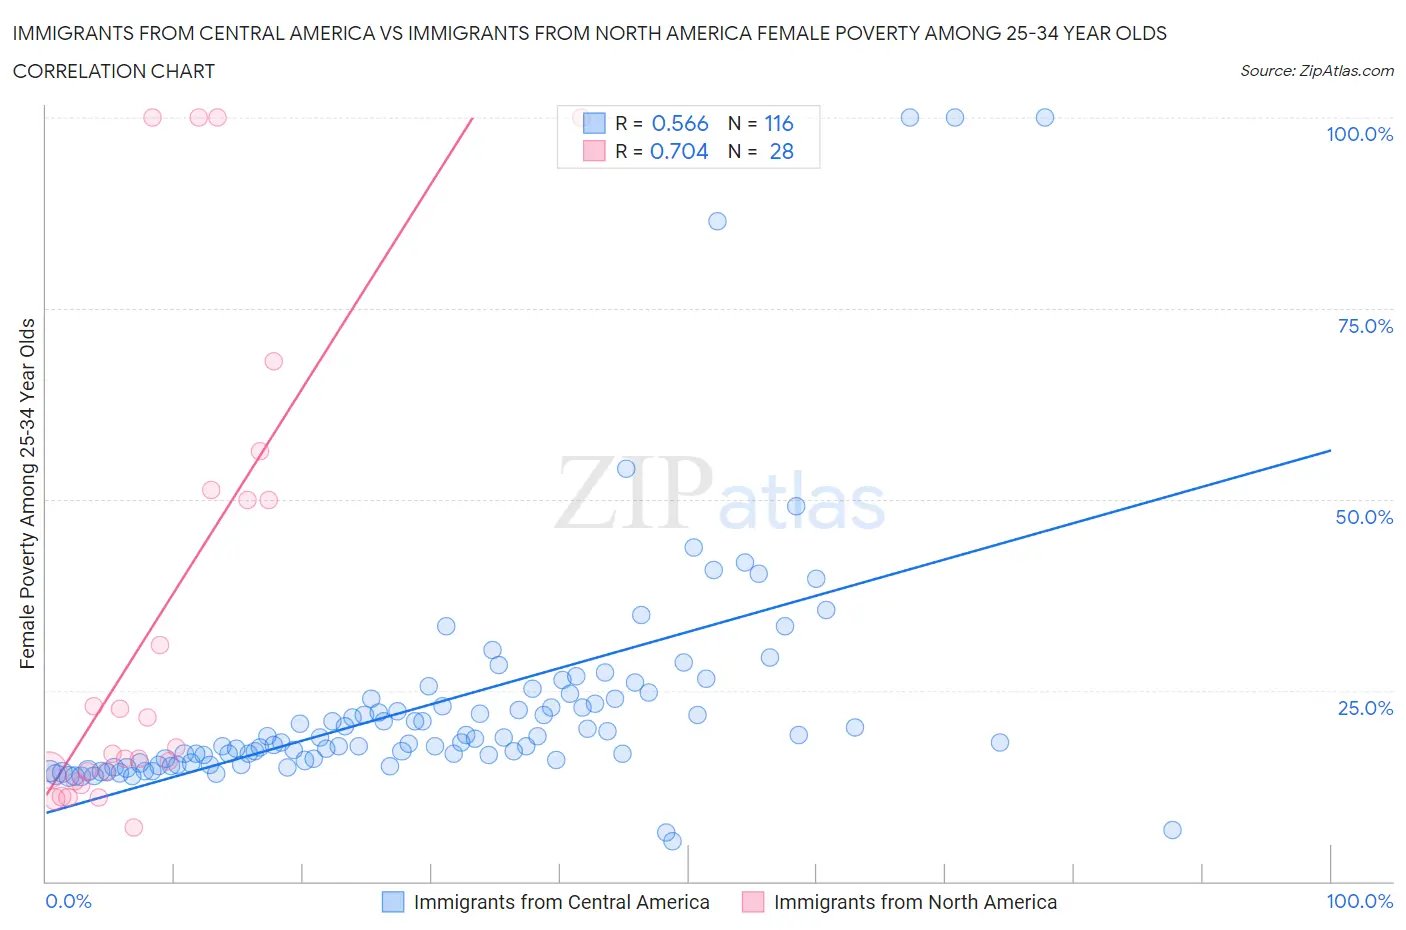
Immigrants from Central America vs Immigrants from North America Female Poverty Among 25-34 Year Olds Correlation Chart
The statistical analysis conducted on geographies consisting of 522,040,118 people shows a substantial positive correlation between the proportion of Immigrants from Central America and poverty level among females between the ages 25 and 34 in the United States with a correlation coefficient (R) of 0.566 and weighted average of 16.6%. Similarly, the statistical analysis conducted on geographies consisting of 451,227,492 people shows a strong positive correlation between the proportion of Immigrants from North America and poverty level among females between the ages 25 and 34 in the United States with a correlation coefficient (R) of 0.704 and weighted average of 12.9%, a difference of 28.2%.
Female Poverty Among 25-34 Year Olds Correlation Summary
| Measurement | Immigrants from Central America | Immigrants from North America |
| Minimum | 5.3% | 7.1% |
| Maximum | 100.0% | 100.0% |
| Range | 94.7% | 92.9% |
| Mean | 23.3% | 34.8% |
| Median | 18.5% | 17.1% |
| Interquartile 25% (IQ1) | 15.6% | 13.7% |
| Interquartile 75% (IQ3) | 23.9% | 50.6% |
| Interquartile Range (IQR) | 8.2% | 36.9% |
| Standard Deviation (Sample) | 16.1% | 31.5% |
| Standard Deviation (Population) | 16.0% | 30.9% |
Similar Demographics by Female Poverty Among 25-34 Year Olds
Demographics Similar to Immigrants from Central America by Female Poverty Among 25-34 Year Olds
In terms of female poverty among 25-34 year olds, the demographic groups most similar to Immigrants from Central America are Mexican (16.6%, a difference of 0.080%), Hispanic or Latino (16.6%, a difference of 0.27%), Immigrants from Guatemala (16.6%, a difference of 0.33%), Potawatomi (16.5%, a difference of 0.36%), and Immigrants from Dominica (16.5%, a difference of 0.63%).
| Demographics | Rating | Rank | Female Poverty Among 25-34 Year Olds |
| Americans | 0.0 /100 | #287 | Tragic 16.4% |
| Guatemalans | 0.0 /100 | #288 | Tragic 16.4% |
| Osage | 0.0 /100 | #289 | Tragic 16.4% |
| Indonesians | 0.0 /100 | #290 | Tragic 16.4% |
| Comanche | 0.0 /100 | #291 | Tragic 16.5% |
| Immigrants | Dominica | 0.0 /100 | #292 | Tragic 16.5% |
| Potawatomi | 0.0 /100 | #293 | Tragic 16.5% |
| Immigrants | Central America | 0.0 /100 | #294 | Tragic 16.6% |
| Mexicans | 0.0 /100 | #295 | Tragic 16.6% |
| Hispanics or Latinos | 0.0 /100 | #296 | Tragic 16.6% |
| Immigrants | Guatemala | 0.0 /100 | #297 | Tragic 16.6% |
| Blackfeet | 0.0 /100 | #298 | Tragic 16.7% |
| Spanish Americans | 0.0 /100 | #299 | Tragic 16.7% |
| U.S. Virgin Islanders | 0.0 /100 | #300 | Tragic 16.7% |
| Immigrants | Congo | 0.0 /100 | #301 | Tragic 16.7% |
Demographics Similar to Immigrants from North America by Female Poverty Among 25-34 Year Olds
In terms of female poverty among 25-34 year olds, the demographic groups most similar to Immigrants from North America are Immigrants from Uzbekistan (12.9%, a difference of 0.030%), Syrian (12.9%, a difference of 0.12%), Czech (12.9%, a difference of 0.13%), Pakistani (13.0%, a difference of 0.30%), and Immigrants from Hungary (13.0%, a difference of 0.32%).
| Demographics | Rating | Rank | Female Poverty Among 25-34 Year Olds |
| Immigrants | Western Asia | 92.7 /100 | #122 | Exceptional 12.8% |
| Slovenes | 92.7 /100 | #123 | Exceptional 12.8% |
| Immigrants | Netherlands | 92.0 /100 | #124 | Exceptional 12.8% |
| Immigrants | Canada | 91.5 /100 | #125 | Exceptional 12.9% |
| Immigrants | Fiji | 91.2 /100 | #126 | Exceptional 12.9% |
| Czechs | 90.3 /100 | #127 | Exceptional 12.9% |
| Syrians | 90.2 /100 | #128 | Exceptional 12.9% |
| Immigrants | North America | 89.7 /100 | #129 | Excellent 12.9% |
| Immigrants | Uzbekistan | 89.6 /100 | #130 | Excellent 12.9% |
| Pakistanis | 88.4 /100 | #131 | Excellent 13.0% |
| Immigrants | Hungary | 88.3 /100 | #132 | Excellent 13.0% |
| Serbians | 87.6 /100 | #133 | Excellent 13.0% |
| Afghans | 85.8 /100 | #134 | Excellent 13.0% |
| South Africans | 85.7 /100 | #135 | Excellent 13.0% |
| Immigrants | England | 85.5 /100 | #136 | Excellent 13.0% |