Nigerian vs Cuban Female Poverty Among 25-34 Year Olds
COMPARE
Nigerian
Cuban
Female Poverty Among 25-34 Year Olds
Female Poverty Among 25-34 Year Olds Comparison
Nigerians
Cubans
14.4%
FEMALE POVERTY AMONG 25-34 YEAR OLDS
4.2/ 100
METRIC RATING
223rd/ 347
METRIC RANK
14.7%
FEMALE POVERTY AMONG 25-34 YEAR OLDS
1.6/ 100
METRIC RATING
234th/ 347
METRIC RANK
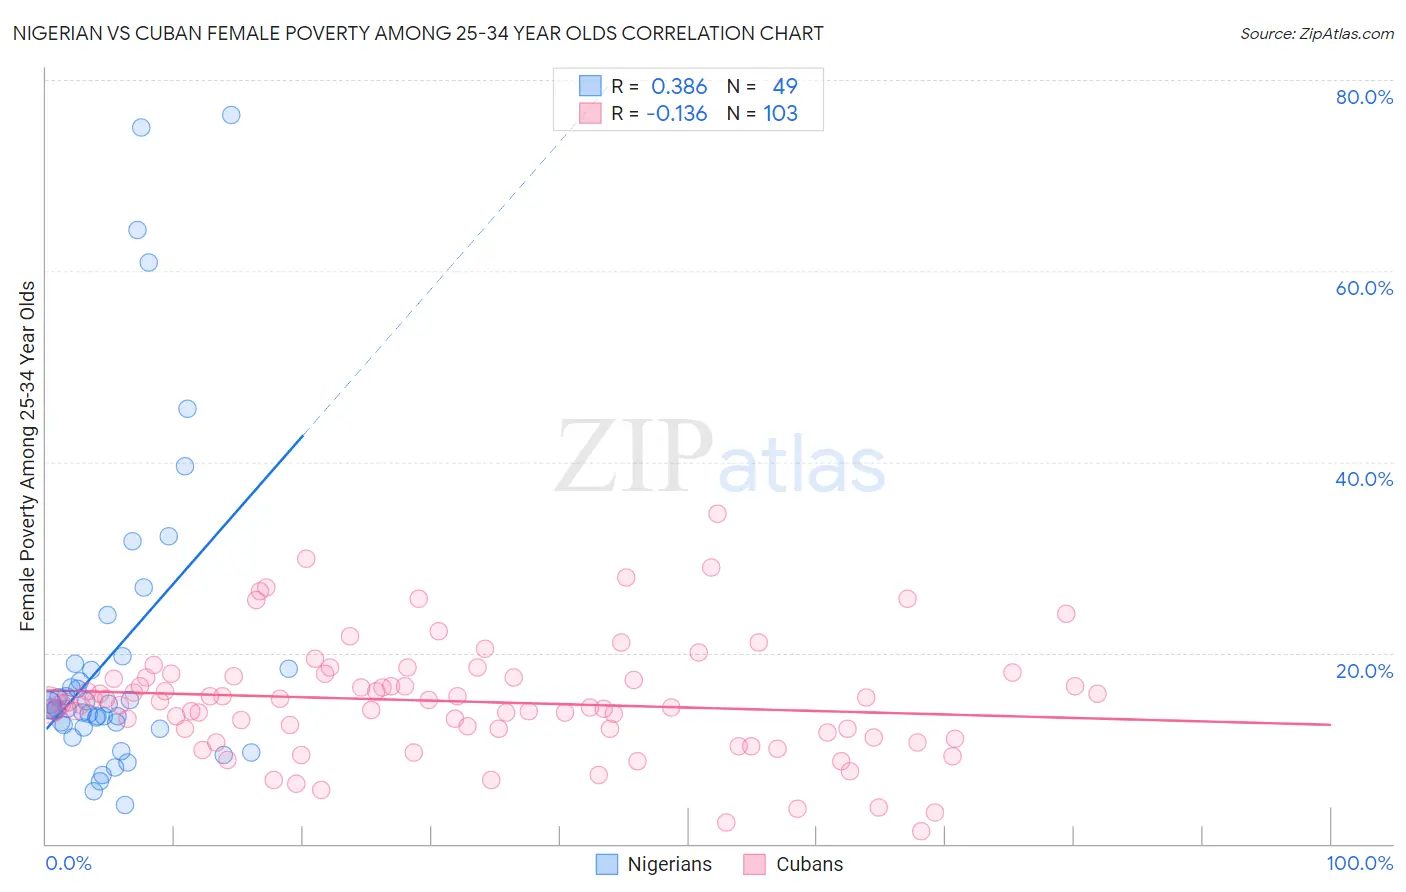
Nigerian vs Cuban Female Poverty Among 25-34 Year Olds Correlation Chart
The statistical analysis conducted on geographies consisting of 329,631,397 people shows a mild positive correlation between the proportion of Nigerians and poverty level among females between the ages 25 and 34 in the United States with a correlation coefficient (R) of 0.386 and weighted average of 14.4%. Similarly, the statistical analysis conducted on geographies consisting of 440,903,752 people shows a poor negative correlation between the proportion of Cubans and poverty level among females between the ages 25 and 34 in the United States with a correlation coefficient (R) of -0.136 and weighted average of 14.7%, a difference of 2.0%.
Female Poverty Among 25-34 Year Olds Correlation Summary
| Measurement | Nigerian | Cuban |
| Minimum | 4.0% | 1.3% |
| Maximum | 76.3% | 34.5% |
| Range | 72.3% | 33.3% |
| Mean | 20.1% | 14.9% |
| Median | 14.2% | 14.7% |
| Interquartile 25% (IQ1) | 12.3% | 11.7% |
| Interquartile 75% (IQ3) | 18.6% | 17.4% |
| Interquartile Range (IQR) | 6.2% | 5.7% |
| Standard Deviation (Sample) | 16.8% | 6.0% |
| Standard Deviation (Population) | 16.7% | 6.0% |
Demographics Similar to Nigerians and Cubans by Female Poverty Among 25-34 Year Olds
In terms of female poverty among 25-34 year olds, the demographic groups most similar to Nigerians are Immigrants from Portugal (14.4%, a difference of 0.060%), Immigrants from Sudan (14.4%, a difference of 0.070%), Sudanese (14.4%, a difference of 0.13%), Ghanaian (14.4%, a difference of 0.29%), and Immigrants from Barbados (14.5%, a difference of 0.39%). Similarly, the demographic groups most similar to Cubans are Immigrants from Jamaica (14.7%, a difference of 0.18%), Salvadoran (14.7%, a difference of 0.20%), Immigrants from Ghana (14.7%, a difference of 0.20%), White/Caucasian (14.7%, a difference of 0.23%), and Alsatian (14.7%, a difference of 0.24%).
| Demographics | Rating | Rank | Female Poverty Among 25-34 Year Olds |
| Immigrants | Thailand | 5.2 /100 | #218 | Tragic 14.3% |
| Ecuadorians | 5.2 /100 | #219 | Tragic 14.3% |
| Ghanaians | 4.8 /100 | #220 | Tragic 14.4% |
| Sudanese | 4.4 /100 | #221 | Tragic 14.4% |
| Immigrants | Portugal | 4.3 /100 | #222 | Tragic 14.4% |
| Nigerians | 4.2 /100 | #223 | Tragic 14.4% |
| Immigrants | Sudan | 4.0 /100 | #224 | Tragic 14.4% |
| Immigrants | Barbados | 3.4 /100 | #225 | Tragic 14.5% |
| Nicaraguans | 3.3 /100 | #226 | Tragic 14.5% |
| Celtics | 2.8 /100 | #227 | Tragic 14.5% |
| Vietnamese | 2.6 /100 | #228 | Tragic 14.6% |
| Spanish | 2.5 /100 | #229 | Tragic 14.6% |
| Spaniards | 2.3 /100 | #230 | Tragic 14.6% |
| Delaware | 2.3 /100 | #231 | Tragic 14.6% |
| Immigrants | Ecuador | 1.9 /100 | #232 | Tragic 14.6% |
| Whites/Caucasians | 1.8 /100 | #233 | Tragic 14.7% |
| Cubans | 1.6 /100 | #234 | Tragic 14.7% |
| Immigrants | Jamaica | 1.4 /100 | #235 | Tragic 14.7% |
| Salvadorans | 1.4 /100 | #236 | Tragic 14.7% |
| Immigrants | Ghana | 1.4 /100 | #237 | Tragic 14.7% |
| Alsatians | 1.4 /100 | #238 | Tragic 14.7% |