Mexican American Indian vs Cuban Female Poverty Among 25-34 Year Olds
COMPARE
Mexican American Indian
Cuban
Female Poverty Among 25-34 Year Olds
Female Poverty Among 25-34 Year Olds Comparison
Mexican American Indians
Cubans
15.4%
FEMALE POVERTY AMONG 25-34 YEAR OLDS
0.2/ 100
METRIC RATING
263rd/ 347
METRIC RANK
14.7%
FEMALE POVERTY AMONG 25-34 YEAR OLDS
1.6/ 100
METRIC RATING
234th/ 347
METRIC RANK
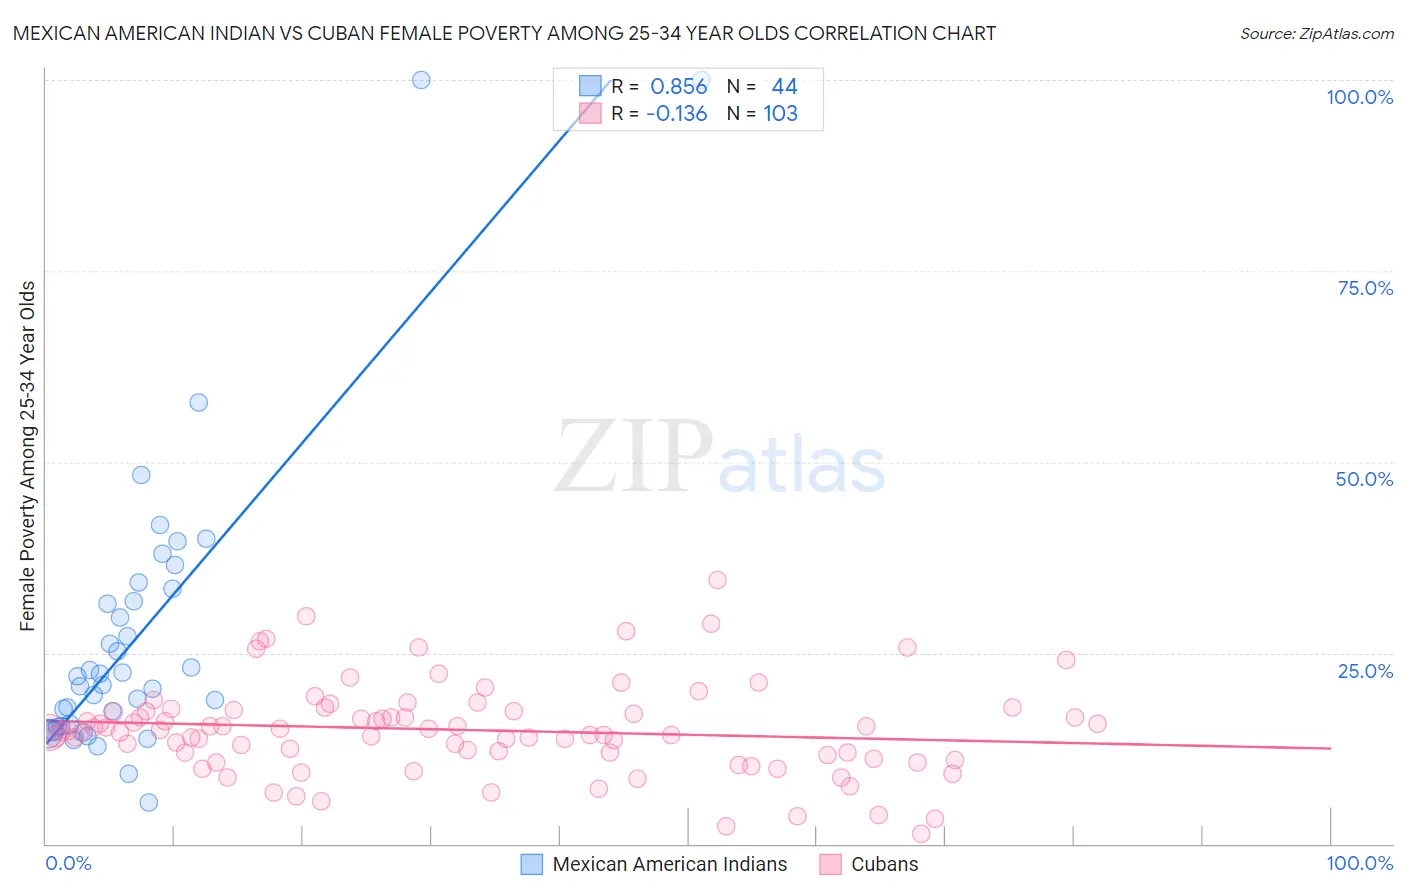
Mexican American Indian vs Cuban Female Poverty Among 25-34 Year Olds Correlation Chart
The statistical analysis conducted on geographies consisting of 315,662,807 people shows a very strong positive correlation between the proportion of Mexican American Indians and poverty level among females between the ages 25 and 34 in the United States with a correlation coefficient (R) of 0.856 and weighted average of 15.4%. Similarly, the statistical analysis conducted on geographies consisting of 440,903,752 people shows a poor negative correlation between the proportion of Cubans and poverty level among females between the ages 25 and 34 in the United States with a correlation coefficient (R) of -0.136 and weighted average of 14.7%, a difference of 4.5%.
Female Poverty Among 25-34 Year Olds Correlation Summary
| Measurement | Mexican American Indian | Cuban |
| Minimum | 5.3% | 1.3% |
| Maximum | 100.0% | 34.5% |
| Range | 94.7% | 33.3% |
| Mean | 27.2% | 14.9% |
| Median | 21.4% | 14.7% |
| Interquartile 25% (IQ1) | 15.4% | 11.7% |
| Interquartile 75% (IQ3) | 32.6% | 17.4% |
| Interquartile Range (IQR) | 17.2% | 5.7% |
| Standard Deviation (Sample) | 19.4% | 6.0% |
| Standard Deviation (Population) | 19.2% | 6.0% |
Similar Demographics by Female Poverty Among 25-34 Year Olds
Demographics Similar to Mexican American Indians by Female Poverty Among 25-34 Year Olds
In terms of female poverty among 25-34 year olds, the demographic groups most similar to Mexican American Indians are Immigrants from Belize (15.3%, a difference of 0.24%), Liberian (15.3%, a difference of 0.28%), Pennsylvania German (15.4%, a difference of 0.43%), Immigrants from Liberia (15.4%, a difference of 0.47%), and Immigrants from Somalia (15.4%, a difference of 0.48%).
| Demographics | Rating | Rank | Female Poverty Among 25-34 Year Olds |
| West Indians | 0.3 /100 | #256 | Tragic 15.2% |
| Immigrants | Burma/Myanmar | 0.3 /100 | #257 | Tragic 15.2% |
| Nepalese | 0.2 /100 | #258 | Tragic 15.2% |
| Immigrants | Cuba | 0.2 /100 | #259 | Tragic 15.2% |
| Marshallese | 0.2 /100 | #260 | Tragic 15.3% |
| Liberians | 0.2 /100 | #261 | Tragic 15.3% |
| Immigrants | Belize | 0.2 /100 | #262 | Tragic 15.3% |
| Mexican American Indians | 0.2 /100 | #263 | Tragic 15.4% |
| Pennsylvania Germans | 0.1 /100 | #264 | Tragic 15.4% |
| Immigrants | Liberia | 0.1 /100 | #265 | Tragic 15.4% |
| Immigrants | Somalia | 0.1 /100 | #266 | Tragic 15.4% |
| Central Americans | 0.1 /100 | #267 | Tragic 15.5% |
| Immigrants | Senegal | 0.1 /100 | #268 | Tragic 15.6% |
| Sub-Saharan Africans | 0.1 /100 | #269 | Tragic 15.6% |
| British West Indians | 0.1 /100 | #270 | Tragic 15.6% |
Demographics Similar to Cubans by Female Poverty Among 25-34 Year Olds
In terms of female poverty among 25-34 year olds, the demographic groups most similar to Cubans are Immigrants from Jamaica (14.7%, a difference of 0.18%), Salvadoran (14.7%, a difference of 0.20%), Immigrants from Ghana (14.7%, a difference of 0.20%), White/Caucasian (14.7%, a difference of 0.23%), and Alsatian (14.7%, a difference of 0.24%).
| Demographics | Rating | Rank | Female Poverty Among 25-34 Year Olds |
| Celtics | 2.8 /100 | #227 | Tragic 14.5% |
| Vietnamese | 2.6 /100 | #228 | Tragic 14.6% |
| Spanish | 2.5 /100 | #229 | Tragic 14.6% |
| Spaniards | 2.3 /100 | #230 | Tragic 14.6% |
| Delaware | 2.3 /100 | #231 | Tragic 14.6% |
| Immigrants | Ecuador | 1.9 /100 | #232 | Tragic 14.6% |
| Whites/Caucasians | 1.8 /100 | #233 | Tragic 14.7% |
| Cubans | 1.6 /100 | #234 | Tragic 14.7% |
| Immigrants | Jamaica | 1.4 /100 | #235 | Tragic 14.7% |
| Salvadorans | 1.4 /100 | #236 | Tragic 14.7% |
| Immigrants | Ghana | 1.4 /100 | #237 | Tragic 14.7% |
| Alsatians | 1.4 /100 | #238 | Tragic 14.7% |
| Malaysians | 1.4 /100 | #239 | Tragic 14.7% |
| Immigrants | Grenada | 1.3 /100 | #240 | Tragic 14.7% |
| Scotch-Irish | 1.2 /100 | #241 | Tragic 14.8% |