Vietnamese vs Cajun Female Poverty Among 18-24 Year Olds
COMPARE
Vietnamese
Cajun
Female Poverty Among 18-24 Year Olds
Female Poverty Among 18-24 Year Olds Comparison
Vietnamese
Cajuns
21.4%
FEMALE POVERTY AMONG 18-24 YEAR OLDS
0.6/ 100
METRIC RATING
258th/ 347
METRIC RANK
25.7%
FEMALE POVERTY AMONG 18-24 YEAR OLDS
0.0/ 100
METRIC RATING
329th/ 347
METRIC RANK
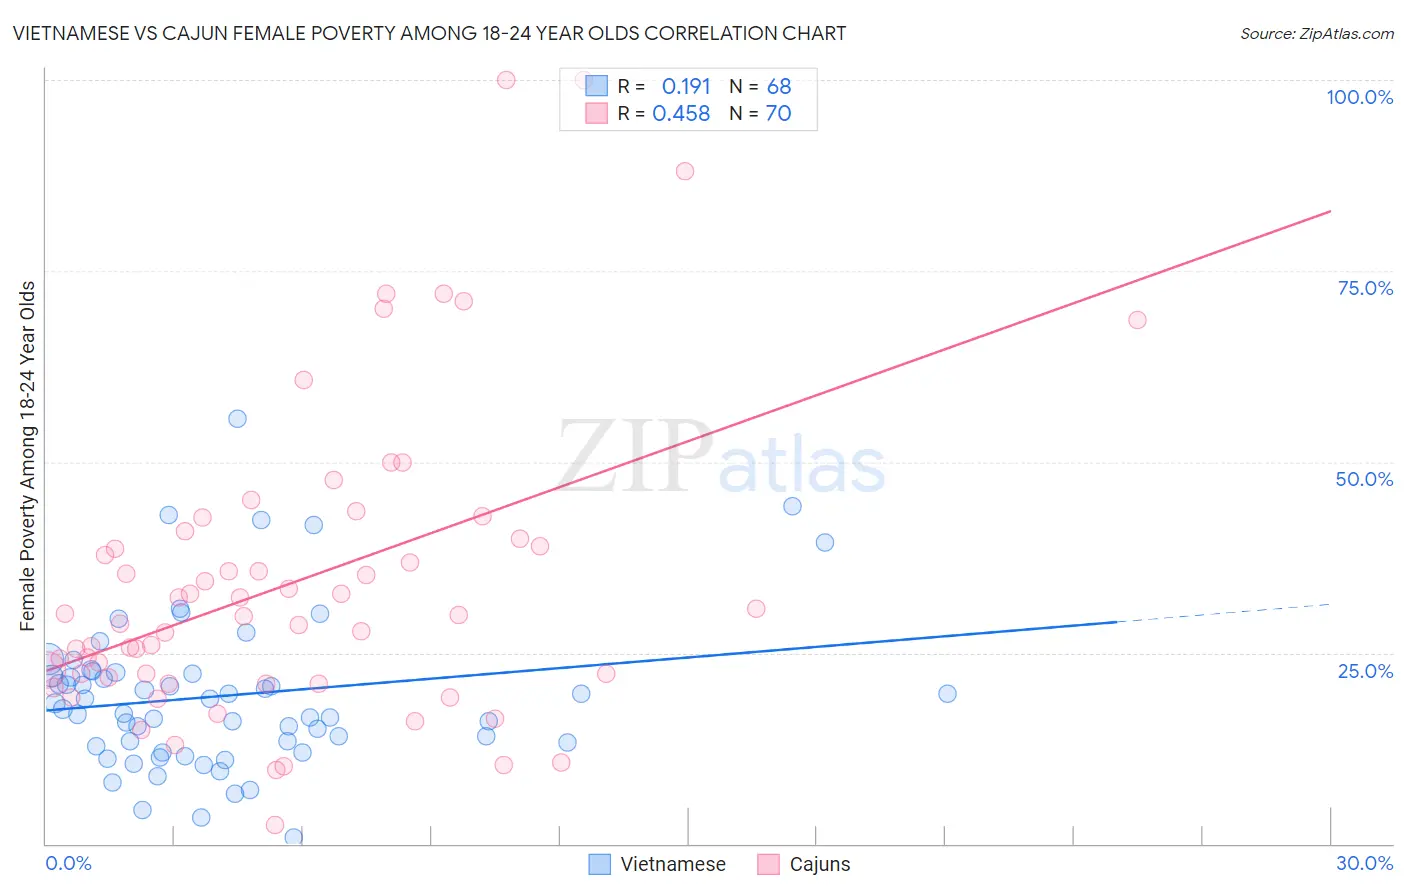
Vietnamese vs Cajun Female Poverty Among 18-24 Year Olds Correlation Chart
The statistical analysis conducted on geographies consisting of 169,238,901 people shows a poor positive correlation between the proportion of Vietnamese and poverty level among females between the ages 18 and 24 in the United States with a correlation coefficient (R) of 0.191 and weighted average of 21.4%. Similarly, the statistical analysis conducted on geographies consisting of 148,140,723 people shows a moderate positive correlation between the proportion of Cajuns and poverty level among females between the ages 18 and 24 in the United States with a correlation coefficient (R) of 0.458 and weighted average of 25.7%, a difference of 20.3%.
Female Poverty Among 18-24 Year Olds Correlation Summary
| Measurement | Vietnamese | Cajun |
| Minimum | 0.84% | 2.4% |
| Maximum | 55.6% | 100.0% |
| Range | 54.8% | 97.6% |
| Mean | 19.4% | 34.3% |
| Median | 18.0% | 29.9% |
| Interquartile 25% (IQ1) | 13.1% | 21.7% |
| Interquartile 75% (IQ3) | 22.3% | 40.0% |
| Interquartile Range (IQR) | 9.3% | 18.3% |
| Standard Deviation (Sample) | 10.2% | 20.2% |
| Standard Deviation (Population) | 10.1% | 20.1% |
Similar Demographics by Female Poverty Among 18-24 Year Olds
Demographics Similar to Vietnamese by Female Poverty Among 18-24 Year Olds
In terms of female poverty among 18-24 year olds, the demographic groups most similar to Vietnamese are Immigrants from France (21.4%, a difference of 0.030%), Immigrants from Norway (21.4%, a difference of 0.080%), Immigrants from Bahamas (21.4%, a difference of 0.14%), Immigrants from Eastern Africa (21.4%, a difference of 0.34%), and Taiwanese (21.2%, a difference of 0.54%).
| Demographics | Rating | Rank | Female Poverty Among 18-24 Year Olds |
| West Indians | 1.9 /100 | #251 | Tragic 21.1% |
| South Africans | 1.6 /100 | #252 | Tragic 21.1% |
| Delaware | 1.6 /100 | #253 | Tragic 21.1% |
| British West Indians | 1.2 /100 | #254 | Tragic 21.2% |
| Immigrants | Grenada | 1.2 /100 | #255 | Tragic 21.2% |
| Tsimshian | 1.0 /100 | #256 | Tragic 21.2% |
| Taiwanese | 1.0 /100 | #257 | Tragic 21.2% |
| Vietnamese | 0.6 /100 | #258 | Tragic 21.4% |
| Immigrants | France | 0.6 /100 | #259 | Tragic 21.4% |
| Immigrants | Norway | 0.6 /100 | #260 | Tragic 21.4% |
| Immigrants | Bahamas | 0.5 /100 | #261 | Tragic 21.4% |
| Immigrants | Eastern Africa | 0.4 /100 | #262 | Tragic 21.4% |
| Icelanders | 0.3 /100 | #263 | Tragic 21.5% |
| Hondurans | 0.3 /100 | #264 | Tragic 21.5% |
| Immigrants | Nonimmigrants | 0.3 /100 | #265 | Tragic 21.5% |
Demographics Similar to Cajuns by Female Poverty Among 18-24 Year Olds
In terms of female poverty among 18-24 year olds, the demographic groups most similar to Cajuns are Immigrants from Somalia (25.7%, a difference of 0.21%), Chippewa (25.9%, a difference of 0.86%), Native/Alaskan (25.4%, a difference of 1.1%), Ute (25.4%, a difference of 1.1%), and Yakama (25.3%, a difference of 1.4%).
| Demographics | Rating | Rank | Female Poverty Among 18-24 Year Olds |
| Somalis | 0.0 /100 | #322 | Tragic 25.1% |
| Arapaho | 0.0 /100 | #323 | Tragic 25.2% |
| German Russians | 0.0 /100 | #324 | Tragic 25.2% |
| Immigrants | Saudi Arabia | 0.0 /100 | #325 | Tragic 25.3% |
| Yakama | 0.0 /100 | #326 | Tragic 25.3% |
| Ute | 0.0 /100 | #327 | Tragic 25.4% |
| Natives/Alaskans | 0.0 /100 | #328 | Tragic 25.4% |
| Cajuns | 0.0 /100 | #329 | Tragic 25.7% |
| Immigrants | Somalia | 0.0 /100 | #330 | Tragic 25.7% |
| Chippewa | 0.0 /100 | #331 | Tragic 25.9% |
| Houma | 0.0 /100 | #332 | Tragic 26.2% |
| Apache | 0.0 /100 | #333 | Tragic 26.3% |
| Pueblo | 0.0 /100 | #334 | Tragic 26.9% |
| Yup'ik | 0.0 /100 | #335 | Tragic 27.0% |
| Immigrants | Yemen | 0.0 /100 | #336 | Tragic 27.5% |