Immigrants from Caribbean vs Blackfeet Female Poverty Among 18-24 Year Olds
COMPARE
Immigrants from Caribbean
Blackfeet
Female Poverty Among 18-24 Year Olds
Female Poverty Among 18-24 Year Olds Comparison
Immigrants from Caribbean
Blackfeet
19.1%
FEMALE POVERTY AMONG 18-24 YEAR OLDS
98.1/ 100
METRIC RATING
102nd/ 347
METRIC RANK
23.6%
FEMALE POVERTY AMONG 18-24 YEAR OLDS
0.0/ 100
METRIC RATING
309th/ 347
METRIC RANK
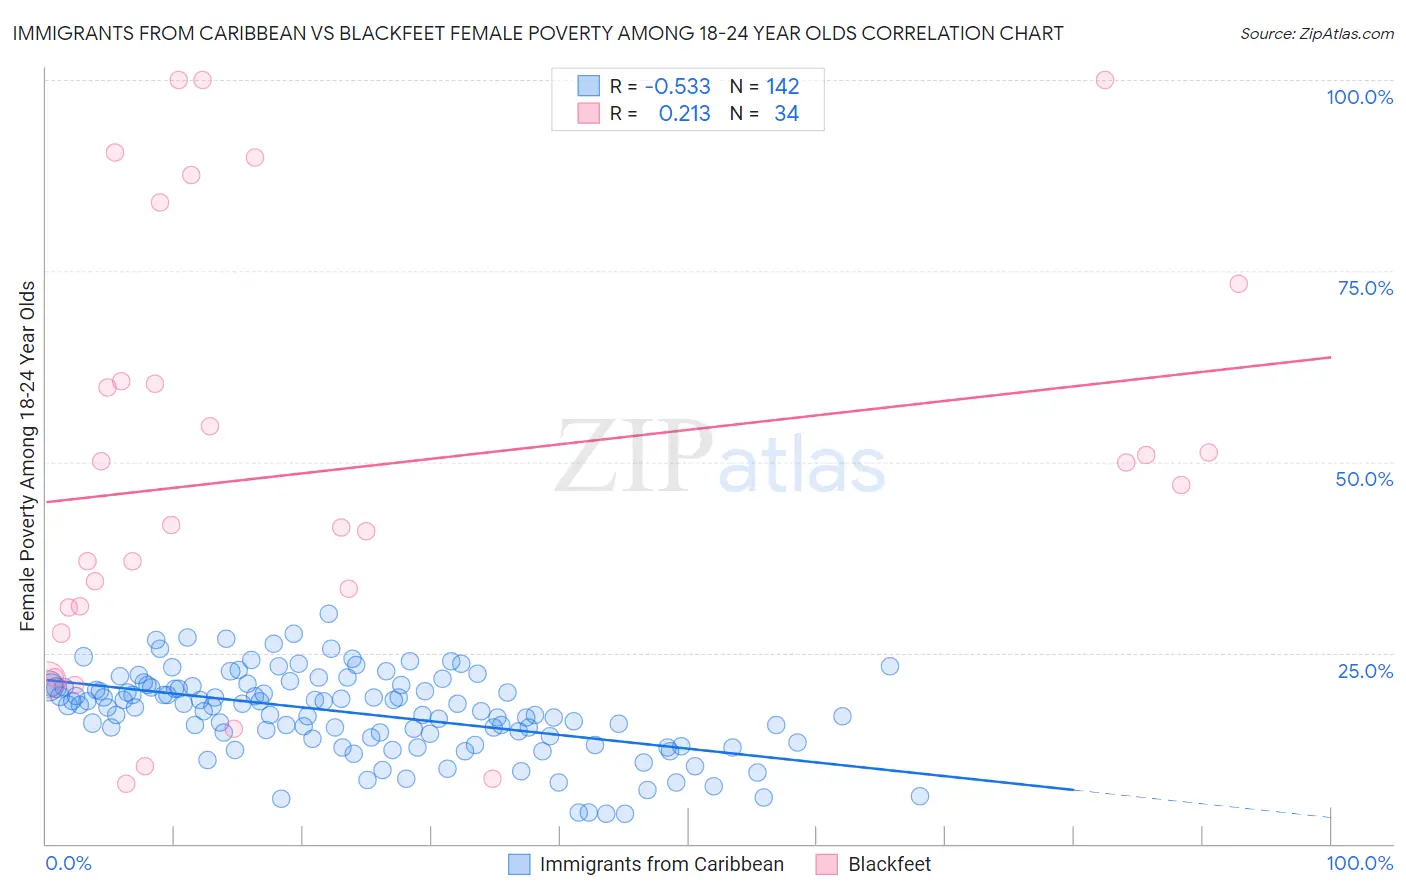
Immigrants from Caribbean vs Blackfeet Female Poverty Among 18-24 Year Olds Correlation Chart
The statistical analysis conducted on geographies consisting of 436,067,401 people shows a substantial negative correlation between the proportion of Immigrants from Caribbean and poverty level among females between the ages 18 and 24 in the United States with a correlation coefficient (R) of -0.533 and weighted average of 19.1%. Similarly, the statistical analysis conducted on geographies consisting of 304,376,728 people shows a weak positive correlation between the proportion of Blackfeet and poverty level among females between the ages 18 and 24 in the United States with a correlation coefficient (R) of 0.213 and weighted average of 23.6%, a difference of 23.4%.
Female Poverty Among 18-24 Year Olds Correlation Summary
| Measurement | Immigrants from Caribbean | Blackfeet |
| Minimum | 4.0% | 7.9% |
| Maximum | 30.2% | 100.0% |
| Range | 26.2% | 92.1% |
| Mean | 17.1% | 49.1% |
| Median | 18.0% | 44.4% |
| Interquartile 25% (IQ1) | 13.9% | 31.0% |
| Interquartile 75% (IQ3) | 20.6% | 60.5% |
| Interquartile Range (IQR) | 6.7% | 29.5% |
| Standard Deviation (Sample) | 5.4% | 27.7% |
| Standard Deviation (Population) | 5.4% | 27.2% |
Similar Demographics by Female Poverty Among 18-24 Year Olds
Demographics Similar to Immigrants from Caribbean by Female Poverty Among 18-24 Year Olds
In terms of female poverty among 18-24 year olds, the demographic groups most similar to Immigrants from Caribbean are Ecuadorian (19.1%, a difference of 0.020%), Serbian (19.1%, a difference of 0.040%), Immigrants from Afghanistan (19.1%, a difference of 0.080%), Chilean (19.1%, a difference of 0.11%), and Immigrants from Czechoslovakia (19.1%, a difference of 0.13%).
| Demographics | Rating | Rank | Female Poverty Among 18-24 Year Olds |
| Guamanians/Chamorros | 98.8 /100 | #95 | Exceptional 19.0% |
| Sierra Leoneans | 98.7 /100 | #96 | Exceptional 19.0% |
| Salvadorans | 98.4 /100 | #97 | Exceptional 19.1% |
| Immigrants | Jordan | 98.4 /100 | #98 | Exceptional 19.1% |
| Immigrants | Czechoslovakia | 98.3 /100 | #99 | Exceptional 19.1% |
| Chileans | 98.3 /100 | #100 | Exceptional 19.1% |
| Ecuadorians | 98.1 /100 | #101 | Exceptional 19.1% |
| Immigrants | Caribbean | 98.1 /100 | #102 | Exceptional 19.1% |
| Serbians | 98.0 /100 | #103 | Exceptional 19.1% |
| Immigrants | Afghanistan | 98.0 /100 | #104 | Exceptional 19.1% |
| Immigrants | Ecuador | 97.8 /100 | #105 | Exceptional 19.2% |
| Immigrants | Sierra Leone | 97.8 /100 | #106 | Exceptional 19.2% |
| Immigrants | Sri Lanka | 97.5 /100 | #107 | Exceptional 19.2% |
| Immigrants | Uzbekistan | 97.3 /100 | #108 | Exceptional 19.2% |
| Immigrants | Syria | 97.2 /100 | #109 | Exceptional 19.2% |
Demographics Similar to Blackfeet by Female Poverty Among 18-24 Year Olds
In terms of female poverty among 18-24 year olds, the demographic groups most similar to Blackfeet are Comanche (23.6%, a difference of 0.050%), Potawatomi (23.7%, a difference of 0.34%), Immigrants from Sudan (23.5%, a difference of 0.45%), Cree (23.4%, a difference of 0.80%), and Paiute (23.3%, a difference of 1.4%).
| Demographics | Rating | Rank | Female Poverty Among 18-24 Year Olds |
| Iroquois | 0.0 /100 | #302 | Tragic 22.9% |
| Senegalese | 0.0 /100 | #303 | Tragic 23.0% |
| Sudanese | 0.0 /100 | #304 | Tragic 23.0% |
| Immigrants | Kuwait | 0.0 /100 | #305 | Tragic 23.0% |
| Paiute | 0.0 /100 | #306 | Tragic 23.3% |
| Cree | 0.0 /100 | #307 | Tragic 23.4% |
| Immigrants | Sudan | 0.0 /100 | #308 | Tragic 23.5% |
| Blackfeet | 0.0 /100 | #309 | Tragic 23.6% |
| Comanche | 0.0 /100 | #310 | Tragic 23.6% |
| Potawatomi | 0.0 /100 | #311 | Tragic 23.7% |
| Yuman | 0.0 /100 | #312 | Tragic 24.0% |
| Creek | 0.0 /100 | #313 | Tragic 24.2% |
| Choctaw | 0.0 /100 | #314 | Tragic 24.3% |
| Blacks/African Americans | 0.0 /100 | #315 | Tragic 24.3% |
| Alsatians | 0.0 /100 | #316 | Tragic 24.4% |