Immigrants from Canada vs Czechoslovakian Seniors Poverty Over the Age of 75
COMPARE
Immigrants from Canada
Czechoslovakian
Seniors Poverty Over the Age of 75
Seniors Poverty Over the Age of 75 Comparison
Immigrants from Canada
Czechoslovakians
11.2%
SENIORS POVERTY OVER THE AGE OF 75
97.9/ 100
METRIC RATING
57th/ 347
METRIC RANK
10.9%
SENIORS POVERTY OVER THE AGE OF 75
99.4/ 100
METRIC RATING
39th/ 347
METRIC RANK
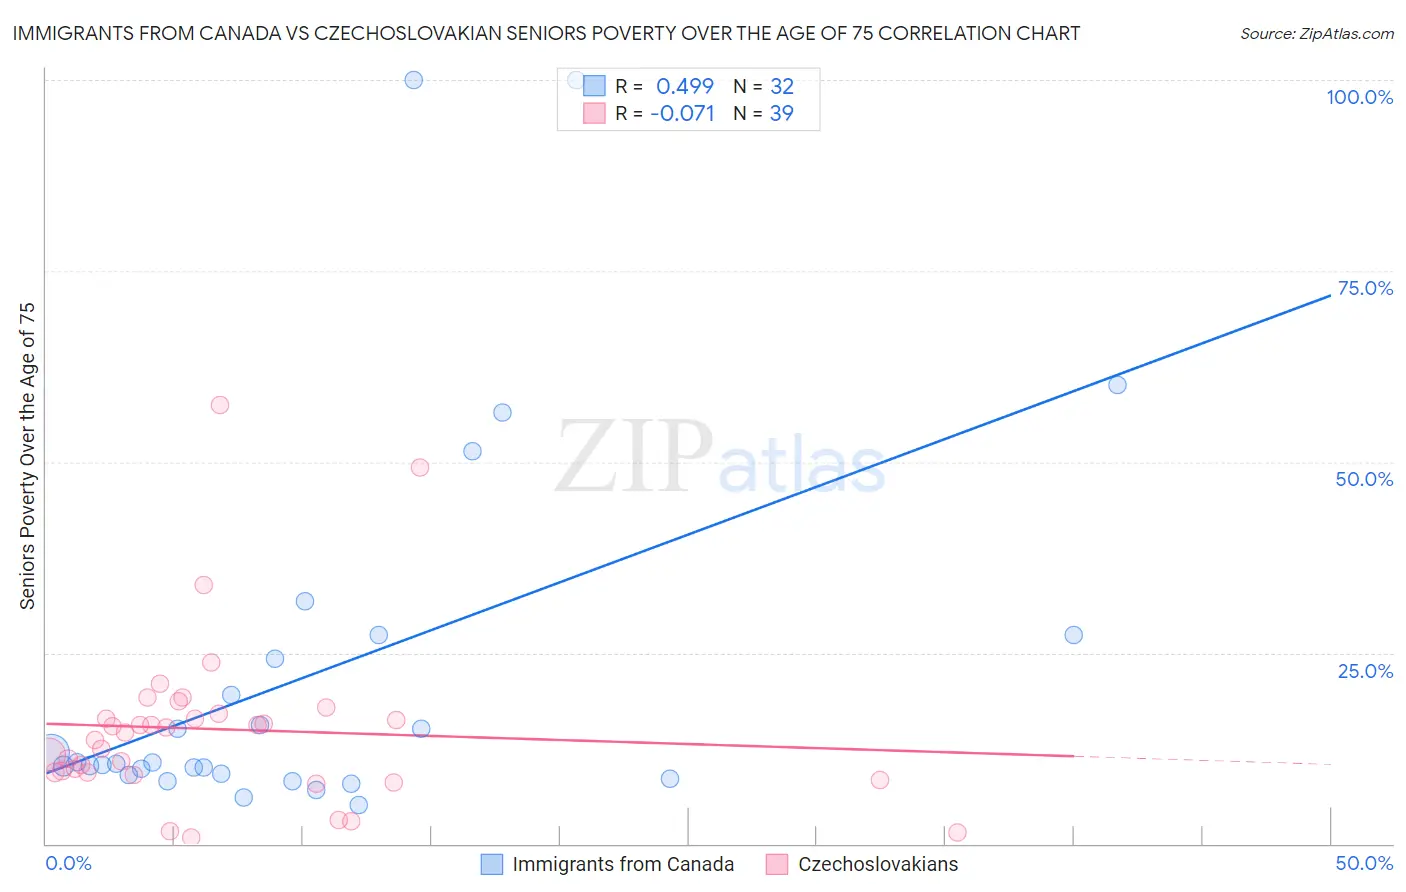
Immigrants from Canada vs Czechoslovakian Seniors Poverty Over the Age of 75 Correlation Chart
The statistical analysis conducted on geographies consisting of 452,026,685 people shows a moderate positive correlation between the proportion of Immigrants from Canada and poverty level among seniors over the age of 75 in the United States with a correlation coefficient (R) of 0.499 and weighted average of 11.2%. Similarly, the statistical analysis conducted on geographies consisting of 364,126,572 people shows a slight negative correlation between the proportion of Czechoslovakians and poverty level among seniors over the age of 75 in the United States with a correlation coefficient (R) of -0.071 and weighted average of 10.9%, a difference of 3.0%.
Seniors Poverty Over the Age of 75 Correlation Summary
| Measurement | Immigrants from Canada | Czechoslovakian |
| Minimum | 5.0% | 0.75% |
| Maximum | 100.0% | 57.4% |
| Range | 95.0% | 56.6% |
| Mean | 22.4% | 15.0% |
| Median | 10.5% | 14.5% |
| Interquartile 25% (IQ1) | 9.1% | 9.4% |
| Interquartile 75% (IQ3) | 25.8% | 16.9% |
| Interquartile Range (IQR) | 16.7% | 7.6% |
| Standard Deviation (Sample) | 24.9% | 11.2% |
| Standard Deviation (Population) | 24.5% | 11.0% |
Demographics Similar to Immigrants from Canada and Czechoslovakians by Seniors Poverty Over the Age of 75
In terms of seniors poverty over the age of 75, the demographic groups most similar to Immigrants from Canada are Yugoslavian (11.2%, a difference of 0.040%), Slavic (11.2%, a difference of 0.23%), Hungarian (11.2%, a difference of 0.24%), Afghan (11.2%, a difference of 0.32%), and Immigrants from England (11.2%, a difference of 0.63%). Similarly, the demographic groups most similar to Czechoslovakians are Thai (10.9%, a difference of 0.22%), Finnish (10.8%, a difference of 0.62%), Immigrants from Lithuania (11.0%, a difference of 0.71%), Austrian (11.0%, a difference of 0.98%), and Celtic (11.0%, a difference of 1.0%).
| Demographics | Rating | Rank | Seniors Poverty Over the Age of 75 |
| Finns | 99.6 /100 | #38 | Exceptional 10.8% |
| Czechoslovakians | 99.4 /100 | #39 | Exceptional 10.9% |
| Thais | 99.4 /100 | #40 | Exceptional 10.9% |
| Immigrants | Lithuania | 99.2 /100 | #41 | Exceptional 11.0% |
| Austrians | 99.1 /100 | #42 | Exceptional 11.0% |
| Celtics | 99.1 /100 | #43 | Exceptional 11.0% |
| Belgians | 99.1 /100 | #44 | Exceptional 11.0% |
| Carpatho Rusyns | 99.0 /100 | #45 | Exceptional 11.1% |
| Greeks | 99.0 /100 | #46 | Exceptional 11.1% |
| Hawaiians | 98.8 /100 | #47 | Exceptional 11.1% |
| French | 98.7 /100 | #48 | Exceptional 11.1% |
| Samoans | 98.7 /100 | #49 | Exceptional 11.1% |
| Serbians | 98.6 /100 | #50 | Exceptional 11.1% |
| Immigrants | North Macedonia | 98.6 /100 | #51 | Exceptional 11.1% |
| Zimbabweans | 98.5 /100 | #52 | Exceptional 11.2% |
| Immigrants | England | 98.4 /100 | #53 | Exceptional 11.2% |
| Afghans | 98.2 /100 | #54 | Exceptional 11.2% |
| Hungarians | 98.1 /100 | #55 | Exceptional 11.2% |
| Slavs | 98.1 /100 | #56 | Exceptional 11.2% |
| Immigrants | Canada | 97.9 /100 | #57 | Exceptional 11.2% |
| Yugoslavians | 97.9 /100 | #58 | Exceptional 11.2% |