Ecuadorian vs Czechoslovakian Seniors Poverty Over the Age of 75
COMPARE
Ecuadorian
Czechoslovakian
Seniors Poverty Over the Age of 75
Seniors Poverty Over the Age of 75 Comparison
Ecuadorians
Czechoslovakians
15.7%
SENIORS POVERTY OVER THE AGE OF 75
0.0/ 100
METRIC RATING
305th/ 347
METRIC RANK
10.9%
SENIORS POVERTY OVER THE AGE OF 75
99.4/ 100
METRIC RATING
39th/ 347
METRIC RANK
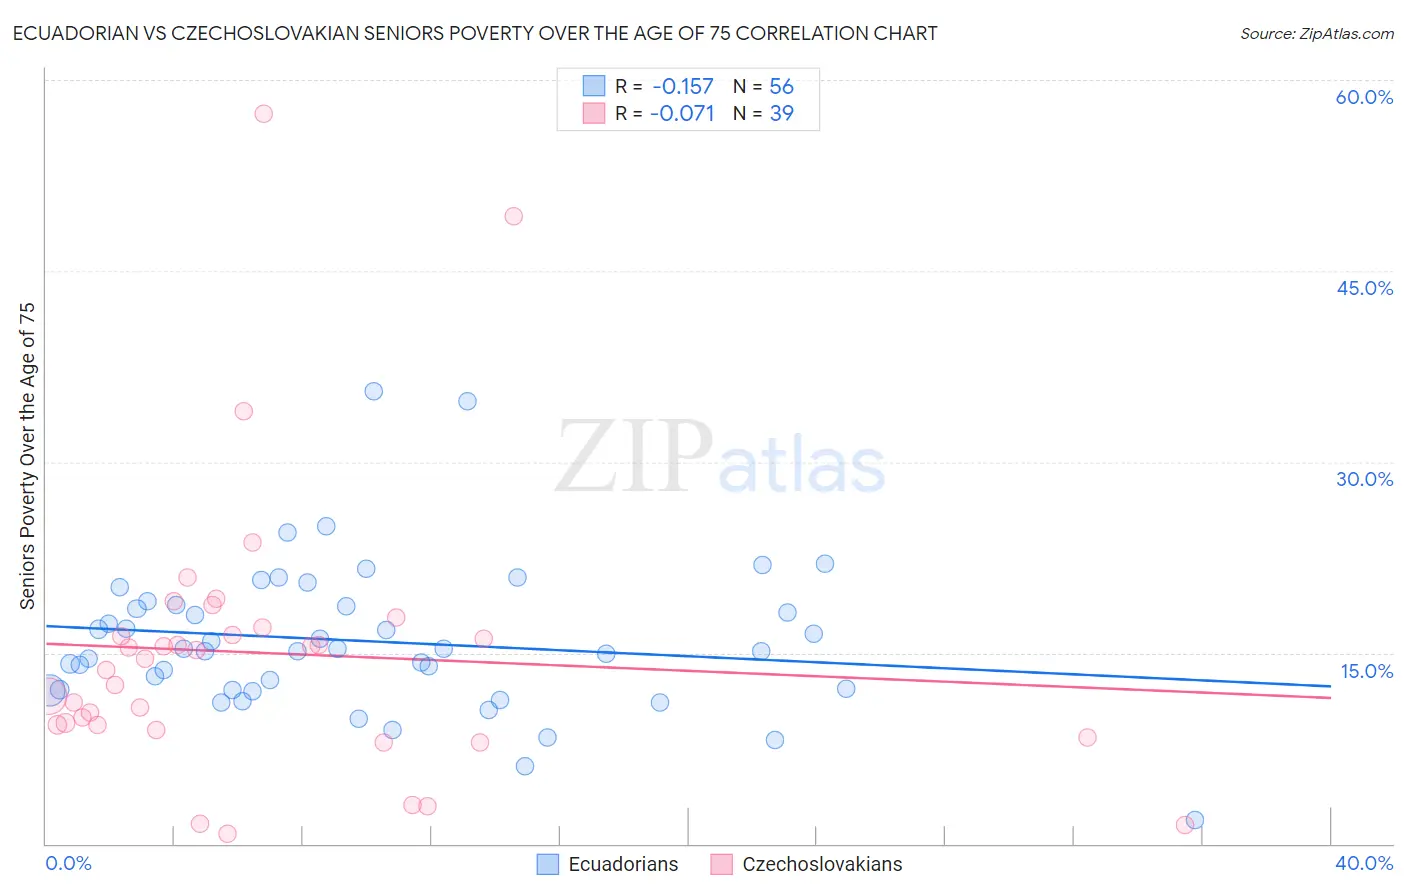
Ecuadorian vs Czechoslovakian Seniors Poverty Over the Age of 75 Correlation Chart
The statistical analysis conducted on geographies consisting of 314,971,208 people shows a poor negative correlation between the proportion of Ecuadorians and poverty level among seniors over the age of 75 in the United States with a correlation coefficient (R) of -0.157 and weighted average of 15.7%. Similarly, the statistical analysis conducted on geographies consisting of 364,126,572 people shows a slight negative correlation between the proportion of Czechoslovakians and poverty level among seniors over the age of 75 in the United States with a correlation coefficient (R) of -0.071 and weighted average of 10.9%, a difference of 44.4%.
Seniors Poverty Over the Age of 75 Correlation Summary
| Measurement | Ecuadorian | Czechoslovakian |
| Minimum | 1.9% | 0.75% |
| Maximum | 35.5% | 57.4% |
| Range | 33.7% | 56.6% |
| Mean | 15.9% | 15.0% |
| Median | 15.2% | 14.5% |
| Interquartile 25% (IQ1) | 12.1% | 9.4% |
| Interquartile 75% (IQ3) | 18.7% | 16.9% |
| Interquartile Range (IQR) | 6.6% | 7.6% |
| Standard Deviation (Sample) | 5.9% | 11.2% |
| Standard Deviation (Population) | 5.8% | 11.0% |
Similar Demographics by Seniors Poverty Over the Age of 75
Demographics Similar to Ecuadorians by Seniors Poverty Over the Age of 75
In terms of seniors poverty over the age of 75, the demographic groups most similar to Ecuadorians are Immigrants from Trinidad and Tobago (15.7%, a difference of 0.040%), Hispanic or Latino (15.8%, a difference of 0.16%), Immigrants from Honduras (15.7%, a difference of 0.22%), Immigrants from West Indies (15.8%, a difference of 0.30%), and Immigrants from Bangladesh (15.8%, a difference of 0.34%).
| Demographics | Rating | Rank | Seniors Poverty Over the Age of 75 |
| Natives/Alaskans | 0.0 /100 | #298 | Tragic 15.5% |
| Spanish American Indians | 0.0 /100 | #299 | Tragic 15.5% |
| Bahamians | 0.0 /100 | #300 | Tragic 15.5% |
| Immigrants | Latin America | 0.0 /100 | #301 | Tragic 15.6% |
| West Indians | 0.0 /100 | #302 | Tragic 15.7% |
| Immigrants | Honduras | 0.0 /100 | #303 | Tragic 15.7% |
| Immigrants | Trinidad and Tobago | 0.0 /100 | #304 | Tragic 15.7% |
| Ecuadorians | 0.0 /100 | #305 | Tragic 15.7% |
| Hispanics or Latinos | 0.0 /100 | #306 | Tragic 15.8% |
| Immigrants | West Indies | 0.0 /100 | #307 | Tragic 15.8% |
| Immigrants | Bangladesh | 0.0 /100 | #308 | Tragic 15.8% |
| Yup'ik | 0.0 /100 | #309 | Tragic 15.8% |
| Vietnamese | 0.0 /100 | #310 | Tragic 15.9% |
| Trinidadians and Tobagonians | 0.0 /100 | #311 | Tragic 15.9% |
| Crow | 0.0 /100 | #312 | Tragic 15.9% |
Demographics Similar to Czechoslovakians by Seniors Poverty Over the Age of 75
In terms of seniors poverty over the age of 75, the demographic groups most similar to Czechoslovakians are Thai (10.9%, a difference of 0.22%), Finnish (10.8%, a difference of 0.62%), Immigrants from Lithuania (11.0%, a difference of 0.71%), Latvian (10.8%, a difference of 0.76%), and Scotch-Irish (10.8%, a difference of 0.93%).
| Demographics | Rating | Rank | Seniors Poverty Over the Age of 75 |
| British | 99.7 /100 | #32 | Exceptional 10.7% |
| Puget Sound Salish | 99.7 /100 | #33 | Exceptional 10.8% |
| Italians | 99.7 /100 | #34 | Exceptional 10.8% |
| Luxembourgers | 99.6 /100 | #35 | Exceptional 10.8% |
| Scotch-Irish | 99.6 /100 | #36 | Exceptional 10.8% |
| Latvians | 99.6 /100 | #37 | Exceptional 10.8% |
| Finns | 99.6 /100 | #38 | Exceptional 10.8% |
| Czechoslovakians | 99.4 /100 | #39 | Exceptional 10.9% |
| Thais | 99.4 /100 | #40 | Exceptional 10.9% |
| Immigrants | Lithuania | 99.2 /100 | #41 | Exceptional 11.0% |
| Austrians | 99.1 /100 | #42 | Exceptional 11.0% |
| Celtics | 99.1 /100 | #43 | Exceptional 11.0% |
| Belgians | 99.1 /100 | #44 | Exceptional 11.0% |
| Carpatho Rusyns | 99.0 /100 | #45 | Exceptional 11.1% |
| Greeks | 99.0 /100 | #46 | Exceptional 11.1% |