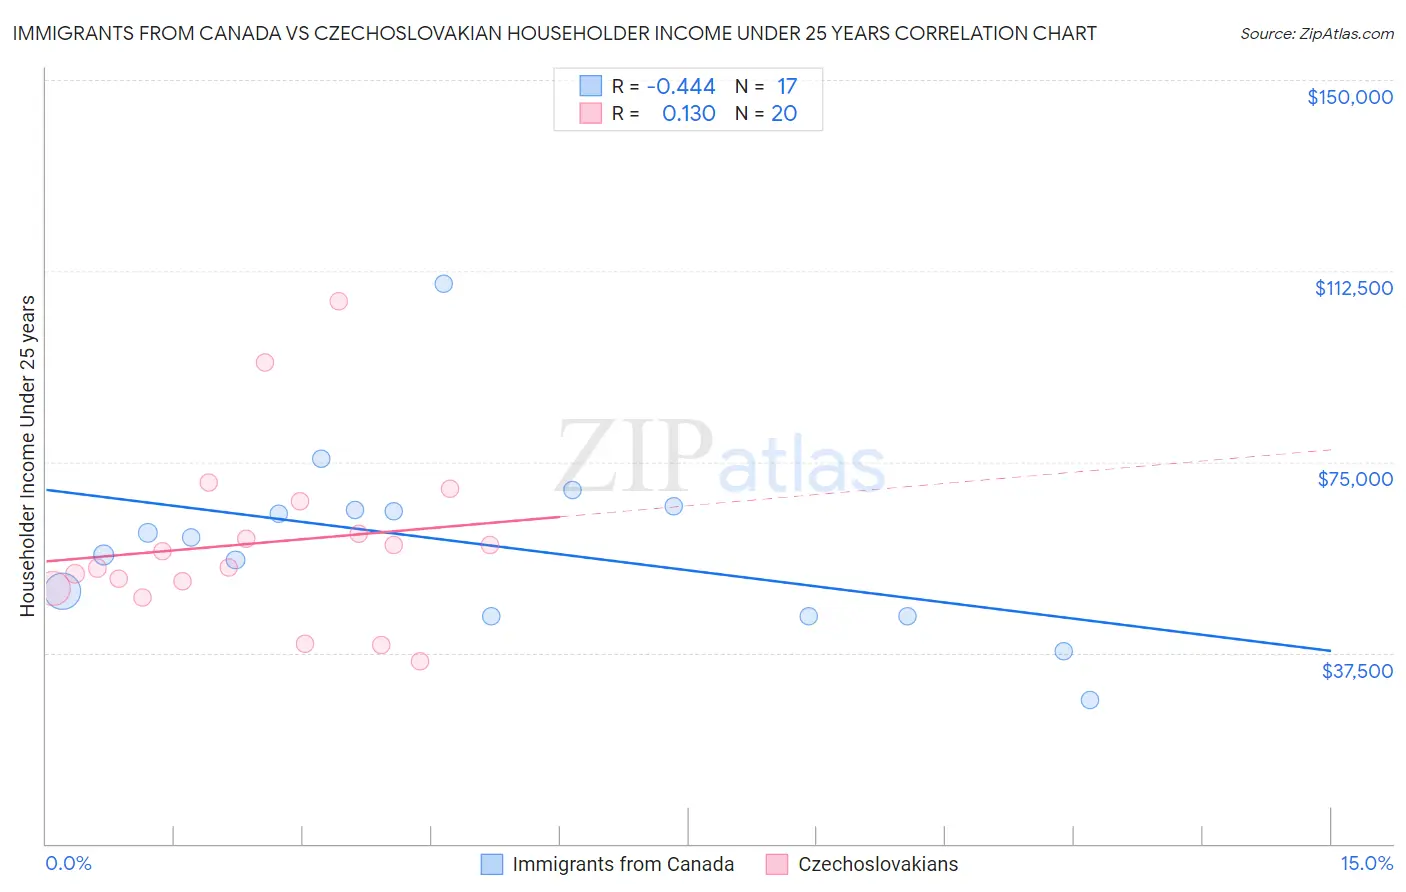
Immigrants from Canada vs Czechoslovakian Householder Income Under 25 years
COMPARE
Immigrants from Canada
Czechoslovakian
Householder Income Under 25 years
Householder Income Under 25 years Comparison
Immigrants from Canada
Czechoslovakians
$53,411
HOUSEHOLDER INCOME UNDER 25 YEARS
95.2/ 100
METRIC RATING
121st/ 347
METRIC RANK
$51,224
HOUSEHOLDER INCOME UNDER 25 YEARS
8.6/ 100
METRIC RATING
217th/ 347
METRIC RANK
Immigrants from Canada vs Czechoslovakian Householder Income Under 25 years Correlation Chart
The statistical analysis conducted on geographies consisting of 375,368,840 people shows a moderate negative correlation between the proportion of Immigrants from Canada and household income with householder under the age of 25 in the United States with a correlation coefficient (R) of -0.444 and weighted average of $53,411. Similarly, the statistical analysis conducted on geographies consisting of 311,218,514 people shows a poor positive correlation between the proportion of Czechoslovakians and household income with householder under the age of 25 in the United States with a correlation coefficient (R) of 0.130 and weighted average of $51,224, a difference of 4.3%.
Householder Income Under 25 years Correlation Summary
| Measurement | Immigrants from Canada | Czechoslovakian |
| Minimum | $28,317 | $35,781 |
| Maximum | $109,961 | $106,448 |
| Range | $81,644 | $70,667 |
| Mean | $58,863 | $59,100 |
| Median | $60,245 | $55,865 |
| Interquartile 25% (IQ1) | $44,733 | $50,876 |
| Interquartile 75% (IQ3) | $65,961 | $64,106 |
| Interquartile Range (IQR) | $21,228 | $13,231 |
| Standard Deviation (Sample) | $18,135 | $17,072 |
| Standard Deviation (Population) | $17,594 | $16,639 |
Similar Demographics by Householder Income Under 25 years
Demographics Similar to Immigrants from Canada by Householder Income Under 25 years
In terms of householder income under 25 years, the demographic groups most similar to Immigrants from Canada are Immigrants from Ethiopia ($53,408, a difference of 0.010%), Guamanian/Chamorro ($53,423, a difference of 0.020%), Italian ($53,426, a difference of 0.030%), Immigrants from Iraq ($53,384, a difference of 0.050%), and Colombian ($53,357, a difference of 0.10%).
| Demographics | Rating | Rank | Householder Income Under 25 years |
| Immigrants | Sweden | 97.1 /100 | #114 | Exceptional $53,621 |
| Immigrants | Albania | 96.9 /100 | #115 | Exceptional $53,597 |
| Immigrants | Spain | 96.6 /100 | #116 | Exceptional $53,560 |
| Lithuanians | 96.6 /100 | #117 | Exceptional $53,552 |
| Immigrants | Switzerland | 96.3 /100 | #118 | Exceptional $53,528 |
| Italians | 95.4 /100 | #119 | Exceptional $53,426 |
| Guamanians/Chamorros | 95.3 /100 | #120 | Exceptional $53,423 |
| Immigrants | Canada | 95.2 /100 | #121 | Exceptional $53,411 |
| Immigrants | Ethiopia | 95.2 /100 | #122 | Exceptional $53,408 |
| Immigrants | Iraq | 94.9 /100 | #123 | Exceptional $53,384 |
| Colombians | 94.6 /100 | #124 | Exceptional $53,357 |
| Pakistanis | 94.1 /100 | #125 | Exceptional $53,325 |
| Immigrants | Serbia | 94.1 /100 | #126 | Exceptional $53,321 |
| Immigrants | North America | 93.9 /100 | #127 | Exceptional $53,307 |
| Immigrants | Bulgaria | 93.9 /100 | #128 | Exceptional $53,305 |
Demographics Similar to Czechoslovakians by Householder Income Under 25 years
In terms of householder income under 25 years, the demographic groups most similar to Czechoslovakians are Immigrants from Belize ($51,223, a difference of 0.0%), French ($51,230, a difference of 0.010%), Arab ($51,219, a difference of 0.010%), Icelander ($51,247, a difference of 0.050%), and Zimbabwean ($51,259, a difference of 0.070%).
| Demographics | Rating | Rank | Householder Income Under 25 years |
| Immigrants | Ghana | 10.9 /100 | #210 | Poor $51,333 |
| Irish | 10.6 /100 | #211 | Poor $51,317 |
| Immigrants | Panama | 9.7 /100 | #212 | Tragic $51,278 |
| Dutch | 9.4 /100 | #213 | Tragic $51,265 |
| Zimbabweans | 9.3 /100 | #214 | Tragic $51,259 |
| Icelanders | 9.1 /100 | #215 | Tragic $51,247 |
| French | 8.7 /100 | #216 | Tragic $51,230 |
| Czechoslovakians | 8.6 /100 | #217 | Tragic $51,224 |
| Immigrants | Belize | 8.6 /100 | #218 | Tragic $51,223 |
| Arabs | 8.5 /100 | #219 | Tragic $51,219 |
| Immigrants | Germany | 8.0 /100 | #220 | Tragic $51,190 |
| Immigrants | Eastern Africa | 7.4 /100 | #221 | Tragic $51,158 |
| Spaniards | 6.8 /100 | #222 | Tragic $51,117 |
| Serbians | 6.6 /100 | #223 | Tragic $51,106 |
| Belizeans | 6.4 /100 | #224 | Tragic $51,094 |