Immigrants from Canada vs Immigrants from Laos Seniors Poverty Over the Age of 75
COMPARE
Immigrants from Canada
Immigrants from Laos
Seniors Poverty Over the Age of 75
Seniors Poverty Over the Age of 75 Comparison
Immigrants from Canada
Immigrants from Laos
11.2%
SENIORS POVERTY OVER THE AGE OF 75
97.9/ 100
METRIC RATING
57th/ 347
METRIC RANK
12.0%
SENIORS POVERTY OVER THE AGE OF 75
71.5/ 100
METRIC RATING
142nd/ 347
METRIC RANK
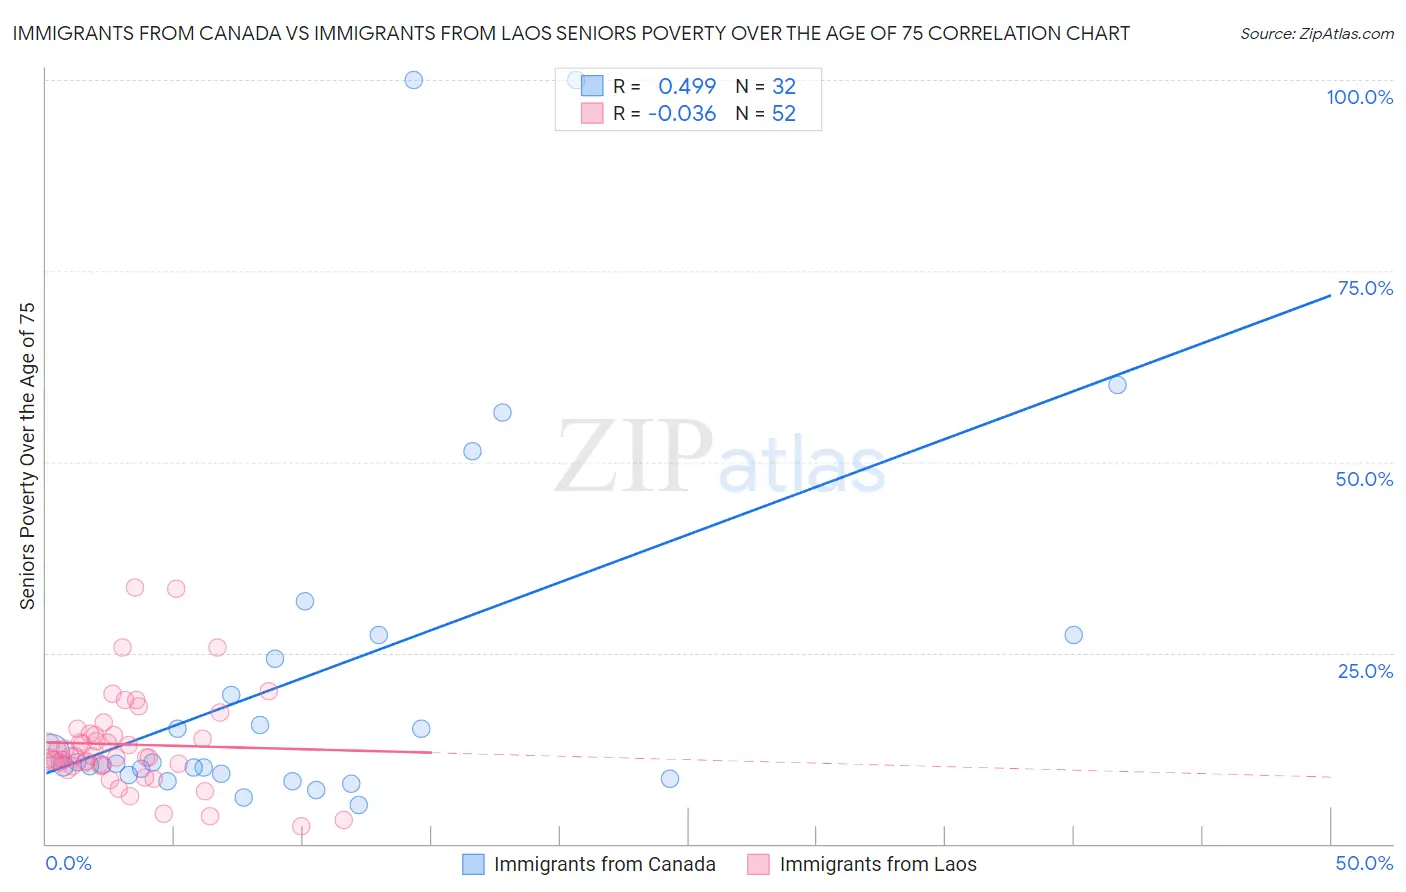
Immigrants from Canada vs Immigrants from Laos Seniors Poverty Over the Age of 75 Correlation Chart
The statistical analysis conducted on geographies consisting of 452,026,685 people shows a moderate positive correlation between the proportion of Immigrants from Canada and poverty level among seniors over the age of 75 in the United States with a correlation coefficient (R) of 0.499 and weighted average of 11.2%. Similarly, the statistical analysis conducted on geographies consisting of 200,379,282 people shows no correlation between the proportion of Immigrants from Laos and poverty level among seniors over the age of 75 in the United States with a correlation coefficient (R) of -0.036 and weighted average of 12.0%, a difference of 6.5%.
Seniors Poverty Over the Age of 75 Correlation Summary
| Measurement | Immigrants from Canada | Immigrants from Laos |
| Minimum | 5.0% | 2.3% |
| Maximum | 100.0% | 33.6% |
| Range | 95.0% | 31.3% |
| Mean | 22.4% | 13.0% |
| Median | 10.5% | 11.4% |
| Interquartile 25% (IQ1) | 9.1% | 10.4% |
| Interquartile 75% (IQ3) | 25.8% | 14.3% |
| Interquartile Range (IQR) | 16.7% | 3.9% |
| Standard Deviation (Sample) | 24.9% | 6.3% |
| Standard Deviation (Population) | 24.5% | 6.2% |
Similar Demographics by Seniors Poverty Over the Age of 75
Demographics Similar to Immigrants from Canada by Seniors Poverty Over the Age of 75
In terms of seniors poverty over the age of 75, the demographic groups most similar to Immigrants from Canada are Yugoslavian (11.2%, a difference of 0.040%), Immigrants from Netherlands (11.2%, a difference of 0.12%), Slavic (11.2%, a difference of 0.23%), Eastern European (11.3%, a difference of 0.23%), and Hungarian (11.2%, a difference of 0.24%).
| Demographics | Rating | Rank | Seniors Poverty Over the Age of 75 |
| Serbians | 98.6 /100 | #50 | Exceptional 11.1% |
| Immigrants | North Macedonia | 98.6 /100 | #51 | Exceptional 11.1% |
| Zimbabweans | 98.5 /100 | #52 | Exceptional 11.2% |
| Immigrants | England | 98.4 /100 | #53 | Exceptional 11.2% |
| Afghans | 98.2 /100 | #54 | Exceptional 11.2% |
| Hungarians | 98.1 /100 | #55 | Exceptional 11.2% |
| Slavs | 98.1 /100 | #56 | Exceptional 11.2% |
| Immigrants | Canada | 97.9 /100 | #57 | Exceptional 11.2% |
| Yugoslavians | 97.9 /100 | #58 | Exceptional 11.2% |
| Immigrants | Netherlands | 97.8 /100 | #59 | Exceptional 11.2% |
| Eastern Europeans | 97.7 /100 | #60 | Exceptional 11.3% |
| Canadians | 97.7 /100 | #61 | Exceptional 11.3% |
| Immigrants | North America | 97.6 /100 | #62 | Exceptional 11.3% |
| Immigrants | Afghanistan | 97.5 /100 | #63 | Exceptional 11.3% |
| Immigrants | Northern Europe | 97.4 /100 | #64 | Exceptional 11.3% |
Demographics Similar to Immigrants from Laos by Seniors Poverty Over the Age of 75
In terms of seniors poverty over the age of 75, the demographic groups most similar to Immigrants from Laos are Immigrants from Cameroon (12.0%, a difference of 0.030%), Immigrants from Pakistan (12.0%, a difference of 0.040%), American (12.0%, a difference of 0.050%), Hmong (12.0%, a difference of 0.060%), and Immigrants from Belgium (12.0%, a difference of 0.060%).
| Demographics | Rating | Rank | Seniors Poverty Over the Age of 75 |
| Immigrants | Ireland | 76.2 /100 | #135 | Good 11.9% |
| Immigrants | Philippines | 75.0 /100 | #136 | Good 11.9% |
| Immigrants | Moldova | 74.1 /100 | #137 | Good 11.9% |
| Immigrants | Romania | 72.6 /100 | #138 | Good 11.9% |
| Immigrants | Kenya | 72.6 /100 | #139 | Good 11.9% |
| Immigrants | Pakistan | 71.9 /100 | #140 | Good 12.0% |
| Immigrants | Cameroon | 71.7 /100 | #141 | Good 12.0% |
| Immigrants | Laos | 71.5 /100 | #142 | Good 12.0% |
| Americans | 71.0 /100 | #143 | Good 12.0% |
| Hmong | 70.8 /100 | #144 | Good 12.0% |
| Immigrants | Belgium | 70.8 /100 | #145 | Good 12.0% |
| Bangladeshis | 70.4 /100 | #146 | Good 12.0% |
| Immigrants | Latvia | 69.1 /100 | #147 | Good 12.0% |
| Immigrants | Zaire | 67.6 /100 | #148 | Good 12.0% |
| Asians | 67.4 /100 | #149 | Good 12.0% |